
Outbound calls: compare traffic and lines
Use Outbound calls to examine attempts, answered calls and durations by agent, line and outcome. The report provides traffic evidence for cost reviews; monetary costs require the applicable carrier tariffs and billing rules.
Define the traffic selection
Open Filters & Search, choose dates, agent aliases, outgoing codes and the line. Refine by extension or called number and apply. Use Only answered or Only failed to investigate outcomes, checking the active-filter indication each time. The selected period follows the CDR call start, calldate; a call crossing midnight remains on its start day.
Compare lines, agents and timing
Use Line to identify where traffic concentrates, Agent for distribution across aliases, and Outbound code or Outcome for the corresponding categories. Hour, Day of month, Day of week, Month and Year provide time groupings. Compare attempts, answer ratio, ringing and conversation duration rather than assuming the busiest line is the most expensive.
Validate a cost comparison
Return to details and inspect representative called numbers and line assignments. For a traffic-direction review, select the relevant destinations using the available called-number filter and repeat by line. Export the filtered data when permitted and combine it with rates, minimum charges and billing increments outside the report. Preserve the period and filter description with that calculation.
Apply a selection and verify the result
A filter chooses which records enter the analysis. A grouping chooses how those records are combined; it does not select a different population by itself. A measure tells you what is counted or timed. Keep these three choices separate when comparing two screens.
Select the period
Use a quick period or open Filters & Search and set From and To. Quick periods retain the other active selections; they are not a full reset.
Apply and inspect
Set the report-specific fields, press Apply filters and wait for the update. Read the active-filter indicator, the total and the table before changing the grouping. If an update fails, do not interpret the previously displayed values as a new result.
Return to the records
Choose Detail to inspect individual rows under the same filters. Sorting a column or changing the page changes the table presentation. CSV describes the successfully applied selection; wait for loading to finish before exporting.
Use help, legends and your saved layout
Click the i beside an indicator, period or chart to read its definition and denominator. Hover over a chart point to see its value. In charts with several series, click a legend item to hide or restore that series; this changes the drawing, not the filtered records. Read units carefully: counts, positions and seconds are different measures even when shown in the same chart.
Drag a KPI card to reorder the indicators. Drag a chart row by its heading to move that row as a unit. Column visibility and layout are saved in your account preferences. Reset layout restores the order of that report without resetting its column visibility. These display choices do not modify PBX data.
Read volume, outcomes and time
All indicators follow the selected outgoing CDR records. Check the denominator before comparing times and response rates.
| Indicator or control | How to read and use it |
|---|---|
| Total / answered / failed | Total selected records; answered means ANSWERED, while failed includes every other outcome. |
| ASR | Answered records divided by all selected records ×100. It is an answer ratio, not a quality score. |
| Average ring | Average total duration minus talk time across all selected records, including unanswered ones. |
| Average talk | Average talk over ANSWERED records only; answered calls with zero talk are included. |
Compare time, agents, lines and outcomes
The available tabs are Detail, Agent, Outbound code, Hour, Day of month, Day of week, Month, Year, Line and Outcome. A line is the outgoing trunk, not an inbound queue. Calendar groupings pool the same component across the selected dates. Use a complete month before comparing Line, then narrow a line in Filters & Search and switch to Agent or Hour to locate its traffic.
In Detail, the main bar chart compares hourly record counts with the preceding period. In grouped views the doughnut and main chart follow the chosen dimension; the latter adds average talk time to current and previous volumes. Use the legend to isolate the series, the talk-duration buckets for duration distribution, the agent ranking and the day/hour heatmap for concentrations. Review Outcome and the Only answered/Only failed controls before comparing carrier use.
For a spending review, export a documented period and selection, identify destinations in the called-number field and apply the provider’s actual tariffs outside Obelisk. Minutes alone omit minimum charges, billing increments and different destination rates. Keep the original report selection with the calculation so another person can reproduce the comparison.
Example: an unexpectedly busy trunk
Compare a completed month by line, then inspect the busiest line by hour and agent. Separate failed attempts from answered conversation minutes. Check destination patterns and the provider invoice before proposing a routing change. After the PBX administrator changes routing, repeat the same analysis on a comparable period to assess the effect.
Use the controls, understand what changes
Drag an individual KPI card to reorder indicators. Drag a chart heading to move its whole row: adjacent charts in that row stay together. The order is saved to your account for this report, without changing filters or calculations.
The column selector belongs to the current grouping. Choose Detail or another grouping before hiding columns. Reset layout restores this report’s panel order but keeps column visibility; it is not a reset of the search filters.
Try dragging from the dotted icon beside each name, or use Move earlier / Move later. This example only changes the cards below.
- Outbound calls
- Average ring time
- Average talk
- Distribution and volume
- Duration and ranking
- Day × hour heatmap
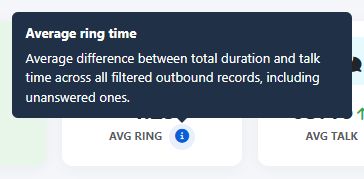
The product’s information button opens on hover or focus. A click keeps the help visible; click again, click outside or press Escape to close it. The examples below reproduce selected product help text; they are teaching controls, not screenshots.
Average difference between total duration and talk time across all filtered outbound records, including unanswered ones.
Read the original information popovers
These captures use the actual product components and their translated help, with illustrative values. Focus or hover over the i icon to open its explanation, click to keep it open, and press Escape or click elsewhere to close it. Check the definition and the available sample before comparing values.
Complete product screenshots
Illustrative data. Open the screenshot to enlarge it and match the controls to the instructions in this chapter.
Open complete screenshot
Read the workspace section by section
Match the numbers and panels below to the complete workspace. These screenshots use illustrative data; the procedures above explain how to work with your own installation.
Outbound activity at a glance
Read total calls, answered and unsuccessful outcomes, answer ratio (ASR) and average ringing time. Average talk time refers to answered calls, helping you assess volume and conversation time together.
Outcomes and hourly volume
Compare answered, unanswered, busy and failed calls, then follow outbound volume by hour. The previous-period series helps you see how activity changes over time.
Duration bands and agent volumes
Explore the distribution by recorded talk duration and the five agents with the most outbound calls. Read volume together with outcomes and duration to assess how activity is distributed.
Outbound activity by day and hour
Locate the busiest outbound time slots at the intersection of weekday and hour. Use this view to compare calling patterns and plan the team’s activity.
Agent, line and outcome for each call
Inspect the agent, extension, outgoing line, dialled number, outcome and ringing, talk and total durations. Group and filter the results, choose columns and export or print your analysis.
Call details
Read individual outbound attempts with the agent, extension, line, outcome and call times.
By agent
Compare outbound attempts, ASR and ringing and talk times by agent.
By outbound code
Compare outbound attempts, ASR and ringing and talk times by outbound code.
By day of month
Compare outbound attempts, ASR and ringing and talk times by day number within the month.
By day of week
Compare outbound attempts, ASR and ringing and talk times by day of the week.
By month
Compare outbound attempts, ASR and ringing and talk times by month.
By year
Compare outbound attempts, ASR and ringing and talk times by year.