

Quality and AI
Read sentiment, resolution, quality, churn, empathy and competitor signals with their analysis coverage.
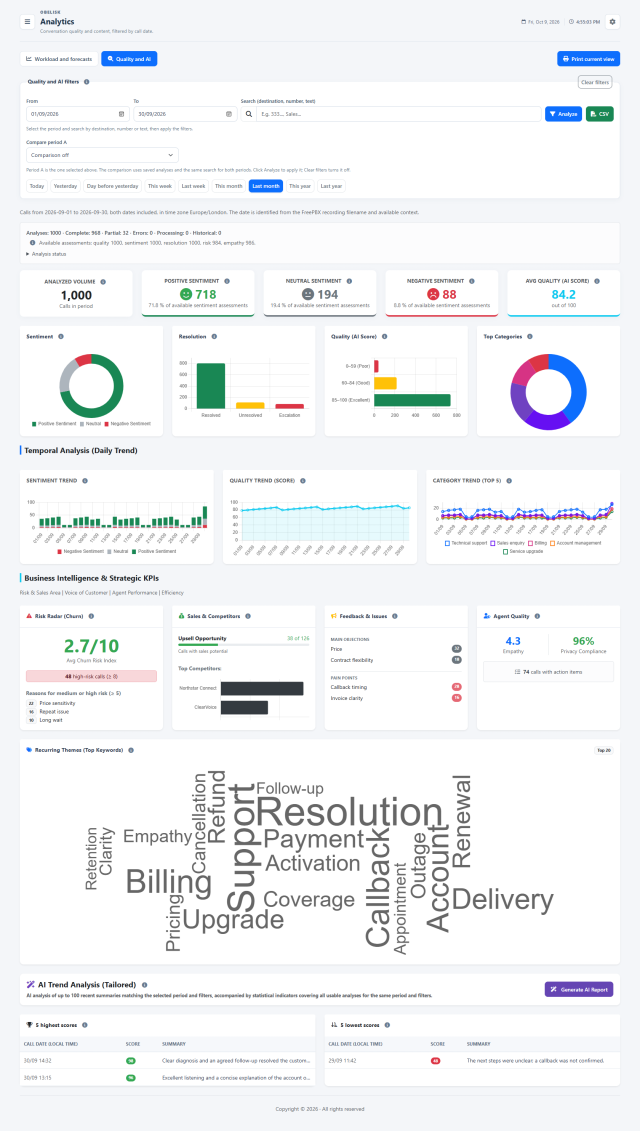
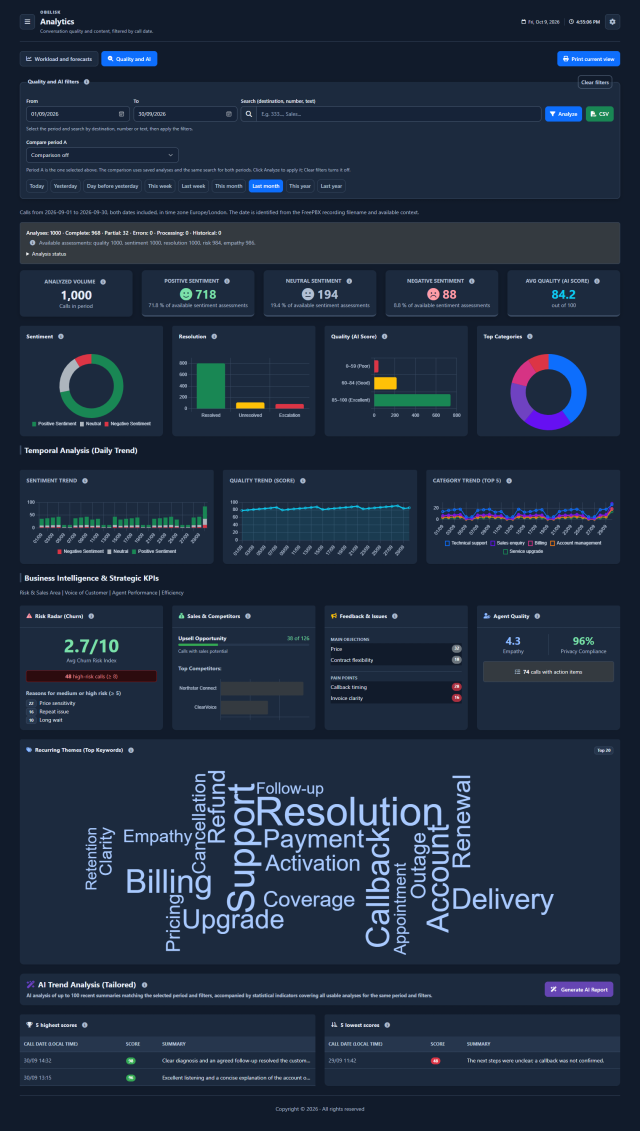
Slide the divider to compare the same workspace.
DarkKnow what to look for.
Choose the period and comparison
Start with call dates and a search term, then choose a preset or custom period. Compare it with another period using saved analyses and the same search criteria.
Understand the available evidence
Read complete, partial, processing and failed analyses alongside the available values for each indicator. A missing assessment is not a zero: coverage helps you interpret differences between periods.
Volume, sentiment and average quality
The first cards summarize the usable analyses, the three sentiment groups and the average quality score. Sentiment percentages use the available sentiment assessments; the average uses the saved quality scores.
Analysed volume
The number of usable saved analyses in the selected period and search. It describes the analysed sample, rather than every call handled by the PBX.
Sentiment
Positive, neutral and negative counts describe the assessed tone. Percentages use the calls with an available sentiment value. Return to the recording to understand the words and context behind a negative signal.
Average quality
The mean of available scores from 0 to 100. The per-call score considers politeness, resolution, empathy and clarity; its explanation remains in the recording analysis.
Explore quality, resolution and categories
Compare the distribution of sentiment, call outcomes and quality bands. Categories show the main subjects found in the saved analyses, helping you choose which conversations deserve a closer review.
Resolution
Counts distinguish resolved requests, unresolved issues and escalation. They describe the outcomes identified in available analyses, helping you choose conversations that need follow-up.
Quality distribution
Read how many available scores fall into each band. The distribution makes weaker calls visible even when the average looks positive; a real score of zero remains a valid assessment.
Leading categories
The chart shows the eight most frequent saved categories. Categories describe subjects such as technical support, administration or sales; the daily trend follows the five leading categories.
Follow the daily pattern
Read daily sentiment volumes, the average quality score and the five leading categories. A peak identifies a day to investigate; compare the available sample and return to the conversations for context.
Connect risk, opportunities and service
Bring churn risk, sales opportunities, competitor mentions and customer feedback together with empathy, privacy mentions and next actions. Read these as indicators from the analysed conversations, with their own available data.
Churn risk
Read the average risk index out of ten and the number of high-risk calls. The reasons concern medium and high risk. This is an AI assessment to investigate, not a measured probability of losing a customer.
Upsell opportunities
The count and progress bar show calls marked as potential opportunities among those with an available upsell assessment. They identify conversations to review, rather than completed sales or revenue.
Competitor mentions
The bars count competitor names found in saved analyses. Use recurring mentions to understand the alternatives discussed by customers; the count does not establish market share or a lost sale.
Objections
The leading objections summarize what customers question or resist, with occurrence counts. Compare price, contract or service concerns and review examples before changing a script or an offer.
Recurring problems
Pain points collect difficulties and frustrations identified in conversations. Their recurrence helps prioritize a process or service review, while the recording provides the detail behind each issue.
Agent empathy
The average uses available empathy assessments on a one-to-five scale. Read it as a coaching signal and compare it with the conversation context, tone and words.
Privacy mentions
The percentage uses available yes/no assessments of privacy or terms being mentioned. It supports script review; it does not certify consent or legal compliance.
Calls with next actions
The indicator counts calls whose saved analysis contains at least one action item. Open the recording analysis to read the commitments and decide how to follow them up.
Recognize recurring subjects
The keyword cloud highlights frequent terms saved by the analyses. Larger words occur more often; use the leading topics to choose where to investigate, then check the summaries and recordings.
Turn the selected evidence into a report
Generate an additional AI reading of recent summaries from the selected period and search, with the statistical context of the usable analyses. The result contains recurring themes, their frequency labels, explanations and strategic advice.
Themes, explanations and a practical next step.
Open an illustrative example in the product’s real report layout. It shows recurring themes, frequency labels, strategic advice and the size of the analysed sample.
In Obelisk, the report is generated on request from saved summaries and indicators. The configured sample limit and available evidence remain visible with the result.
Return to concrete conversations
The five highest and five lowest available scores provide examples for review, with call date, score and summary. Use these calls as coaching material and compare the analysis with the original recording when available.
Your contact centre’s progress. In your inbox.
Scheduled reports turn saved recording analyses into a weekly or monthly reading of recurring issues, business signals and possible next steps.
Weekly trends
Review the previous complete week, from Monday to Sunday. Recent summaries and business signals help identify recurring clusters and an AI strategic recommendation.
Monthly strategic report
Review the previous complete month with aggregate indicators and selected priority summaries. The report examines churn, competitors and recurring problems, and proposes three corrective actions for the next month.
Configure it in administration.
Set the recipients and SMTP connection, report language, Gemini model and sampling limits. Server schedules run the jobs; delivery uses your mail configuration when usable analysis is available and generation succeeds.
Read the signal.
Choose the next step.
Read every indicator with its coverage
Some saved analyses contain a quality score but no usable resolution or risk field. Each indicator uses the values actually available for that measure. Check the coverage and denominators when comparing periods, so a change in available evidence is considered alongside a change in the result.
Move from a recurring theme to an example
Use categories, keywords and business insights to identify a theme, then inspect example summaries and the corresponding recording analysis. The aggregate view helps you choose where to investigate; the individual conversation provides context for a coaching session or a process review.
Compare this period with the previous one, inspect a change in sentiment or resolution and read example summaries. Use Recordings to play audio and inspect the detailed saved analysis. Generate a focused report when you need help interpreting the available summaries.
Put it to work
Filter saved analyses by call period and search, then explore quality scores, sentiment, resolution, categories and daily trends.
Review AI indicators for churn risk, upsell, mentioned competitors, objections, recurring problems, empathy and next actions.
Compare two periods from saved results, inspect the available data behind each measure and generate a separate AI summary when needed.
What you can do
Know what has been analyzed
Saved-analysis coverage and completeness, sentiment, resolution, quality score and categories.
Follow changes over time
Daily sentiment, score and category trends with keyword cloud.
Surface business themes
Business insights: churn risk, sales opportunities, competitor mentions, objections, pain points, empathy and privacy-procedure assessment.
Compare periods fairly
Compare selected period with preceding or custom period, showing available denominators and differences.
Inspect the conversations behind a trend
Inspect example conversations; export individual-call data or aggregate A/B comparison.
Ask for a focused AI report
Generate a tailored Gemini report from existing summaries and filtered BI context; print generated results without another AI request.
Read the detail with confidence
AI scores are assessments, not certified outcomes.
AI scores are assessments, not certified outcomes.
Each measure uses only available fields
Each measure uses only available fields; missing values are not zero.
Period follows date in recording filename
Period follows date in recording filename; may differ from queue report dates.
Viewing existing analysis does not call Gemini
Viewing existing analysis does not call Gemini; explicit generation uses configured Gemini account/quota.
Page access, AI generation and exports are distinct permissions.
Page access, AI generation and exports are distinct permissions.
Choose when to add a new AI reading.
Charts and comparisons aggregate saved analyses locally. Analysing a new recording or generating a new narrative uses Gemini when enabled, with your API key and provider account. Select the content and settings that fit your operation.