
Answered calls: compare volume and handling
This report examines recorded answered queue calls. Use a defined selection to compare agents, queues, time patterns and telephone origins, then return to individual rows to verify what produced the aggregate.
Set dates and search criteria
Open Filters & Search, set From/To, select queues and agents, and add a number, call ID or geographic criterion when needed. Press Apply filters. Quick periods change the date selection; Anomalies highlights conversations shorter than ten seconds. Check the active-filter indication before interpreting totals or exporting.
Choose the level of detail
Switch from call details to Agent, Queue, Hour, Day of month, Day of week, Month or Year. Geographic groupings include Country, Area and City. Grouping changes how the selected records are summarized; it is not a new population. Use the volume/conversation comparison to locate differences worth checking rather than ranking performance from volume alone.
Check time and geography
The period follows the terminal event of the answered queue episode, including supported transfers with valid data. An episode ending after midnight belongs to the following day with its recorded waiting and talk times. Ringing is already part of queue waiting. The origin map and geographic filters use telephone prefixes, not the caller’s physical location; unknown geography must not be treated as a known area.
Apply a selection and verify the result
A filter chooses which records enter the analysis. A grouping chooses how those records are combined; it does not select a different population by itself. A measure tells you what is counted or timed. Keep these three choices separate when comparing two screens.
Select the period
Use a quick period or open Filters & Search and set From and To. Quick periods retain the other active selections; they are not a full reset.
Apply and inspect
Set the report-specific fields, press Apply filters and wait for the update. Read the active-filter indicator, the total and the table before changing the grouping. If an update fails, do not interpret the previously displayed values as a new result.
Return to the records
Choose Detail to inspect individual rows under the same filters. Sorting a column or changing the page changes the table presentation. CSV describes the successfully applied selection; wait for loading to finish before exporting.
Use help, legends and your saved layout
Click the i beside an indicator, period or chart to read its definition and denominator. Hover over a chart point to see its value. In charts with several series, click a legend item to hide or restore that series; this changes the drawing, not the filtered records. Read units carefully: counts, positions and seconds are different measures even when shown in the same chart.
Drag a KPI card to reorder the indicators. Drag a chart row by its heading to move that row as a unit. Column visibility and layout are saved in your account preferences. Reset layout restores the order of that report without resetting its column visibility. These display choices do not modify PBX data.
Read all seven indicators
Read the values over the complete filtered sample, then use an aggregation to locate differences. A good average does not rule out a group of slow calls.
| Indicator or control | How to read and use it |
|---|---|
| Answered records | Count of answered queue episodes in the selected period; compare with an equally filtered previous period. |
| Average wait | Time from queue entry to answer. Agent ringing is already included. |
| Average talk | Conversation duration after answer; waiting is excluded. |
| Total talk | Sum of conversation durations; use it to assess the total handled time. |
| Average entry position | Average position on entering the queue for the answered episodes. |
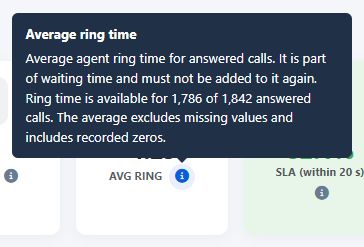
| Average ring and coverage | Use the coverage help to see how many records have a known ring time. Missing time is not a zero-duration ring. |
| Answered within 20 s (%) | Answered episodes with wait ≤20 seconds divided by all answered episodes. This denominator differs from the Global Dashboard answer rate. |
Change the dimension and read the matching charts
The grouping tabs offer Detail, Agent, Queue, Hour, Day of month, Day of week, Month, Year, Country, Area and City. Hour pools the same hour across the selected dates; Day of month pools the same day number, and Month pools the same month number if several years are included. Narrow the date range when you need a single chronological month or day.
In Detail, the doughnut distributes volume by queue and the main chart compares hourly counts with the previous period. In grouped views, both follow the selected dimension: volume is combined with average wait, talk, position and ring time. Additional total/minimum/maximum series are available through the legend. Non-calendar category charts show the leading groups, whereas the table can contain more groups.
Read the waiting and talk distributions for short or long calls, the top-agent panel for volume and average talk, and the day/hour heatmap for concentrations. These panels complement the selected dimension. For a high-volume agent with unusually short talk, apply Anomalies (talk under 10 seconds), inspect Detail and verify a sample in Recordings; the chart alone does not establish poor quality.
Use geographic filters and the map together
In Filters & Search choose Country, then Area and City as available, keeping the desired queues and dates. Apply before reading the map. Heat mode emphasizes concentrations; Cluster groups the available points and lets you inspect their counts. Use the map enlargement control for a larger view, then return to the same report. A missing geographic match remains missing: the map describes telephone-prefix information, not the physical position of a customer.
Understand transfers and answered episodes
An answered record represents a handled queue episode. Supported terminal transfer events can close an episode as well as COMPLETEAGENT or COMPLETECALLER when their required fields are valid. The selected date follows that episode’s terminal event. A call that traverses queues or transfers can therefore generate several report records; do not equate their sum with distinct customers or distinct call IDs.
Use Routing Log to inspect the sequence and Contact journeys to compare distinct calls associated with a normalized number. Import completeness and the events emitted by the PBX determine which episodes are available; an unrecorded transfer cannot be reconstructed from these charts.
Example: investigate a short-call pattern
Select one queue and a completed week, compare agents, then enable Anomalies and inspect call details. Check matching recordings before assuming an agent ended calls prematurely. Repeat the same selection after any coaching intervention. CSV follows report filters and can include more records than the visible table page, subject to export permission.
Use the controls, understand what changes
Drag an individual KPI card to reorder indicators. Drag a chart heading to move its whole row: adjacent charts in that row stay together. The order is saved to your account for this report, without changing filters or calculations.
The column selector belongs to the current grouping. Choose Detail or another grouping before hiding columns. Reset layout restores this report’s panel order but keeps column visibility; it is not a reset of the search filters.
The geographic map follows these draggable rows and stays outside their reorder area. Use its Heatmap/Cluster and fullscreen controls to inspect geography; dragging a chart heading does not move the map into another row.
Try dragging from the dotted icon beside each name, or use Move earlier / Move later. This example only changes the cards below.
- Call count
- Average wait
- Average talk
- Distribution and volume
- Wait, talk duration and top agents
- Day × hour heatmap
The product’s information button opens on hover or focus. A click keeps the help visible; click again, click outside or press Escape to close it. The examples below reproduce selected product help text; they are teaching controls, not screenshots.
Average agent ring time for answered calls. It is part of waiting time and must not be added to it again.
Percentage of answered calls with a queue wait of 20 seconds or less, out of all answered calls. Includes exactly 20 seconds.
Read the original information popovers
These captures use the actual product components and their translated help, with illustrative values. Focus or hover over the i icon to open its explanation, click to keep it open, and press Escape or click elsewhere to close it. Check the definition and the available sample before comparing values.

Complete product screenshots
Illustrative data. Open the screenshot to enlarge it and match the controls to the instructions in this chapter.
Open complete screenshot
Read the workspace section by section
Match the numbers and panels below to the complete workspace. These screenshots use illustrative data; the procedures above explain how to work with your own installation.
The service at a glance
Read answered volume, average waiting and conversation time, total conversation time, average queue position, ringing time and the share answered within 20 seconds. These measures follow the period and filters you selected.
Volumes and the selected dimension
In Detail, compare the distribution across queues and the hourly volume. Switch to Agent, Country, Area or City to read distributions and measures by that dimension. Use the chart legend to select the available series; the previous-period comparison appears in supported views.
Waiting, conversation length and agent volumes
Go beyond an average: see how answered calls fall into waiting-time and conversation-length bands. Alongside them, the five agents with the most answered calls help you read the distribution of activity. Their ranking is based on answered-call volume.
Find recurring peaks by day and hour
Cross the day of the week with the hour. Each heatmap cell shows answered-call volume for that combination within the active selection. Use the concentrations to investigate recurring busy periods, then refine by queue, agent or telephone geography.
Map the telephone origin of calls
Combine Country, Area/Region and City with your period, queues and other filters. Heatmap highlights concentrations; Cluster groups the available geographic points, whose popups show call counts. Expand the map for a wider view. Locations come from telephone-prefix data and the coordinates available for those prefixes.
Answered call details
Return to individual calls or group the same selection by agent, queue, time, country, area or city. Inspect waiting, conversation and ringing times, then choose columns, print the current view or export CSV for further analysis.
Call details
Read individual answered calls with their queue, agent, waiting time and talk time.
By queue
Compare answered call volumes, waiting time and talk time by queue.
By day of month
Compare answered call volumes, waiting time and talk time by day number within the month.
By day of week
Compare answered call volumes, waiting time and talk time by day of the week.
By month
Compare answered call volumes, waiting time and talk time by month.
By year
Compare answered call volumes, waiting time and talk time by year.
By country
Compare answered call volumes, waiting time and talk time by the country associated with the calling number.
By area
Compare answered call volumes, waiting time and talk time by the area associated with the calling number.
By city
Compare answered call volumes, waiting time and talk time by the city associated with the calling number.