

Outbound Calls
Review outbound attempts, answered calls, answer ratio and conversation durations.
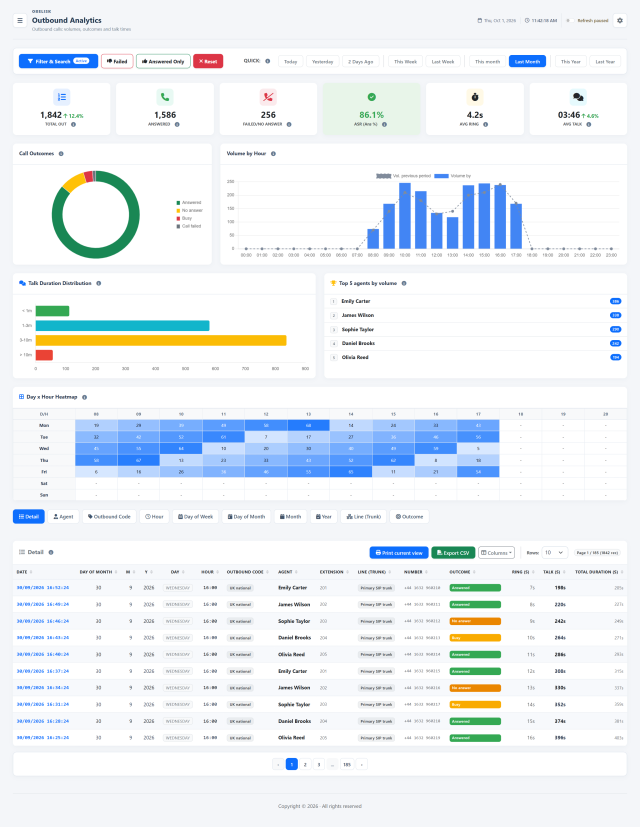
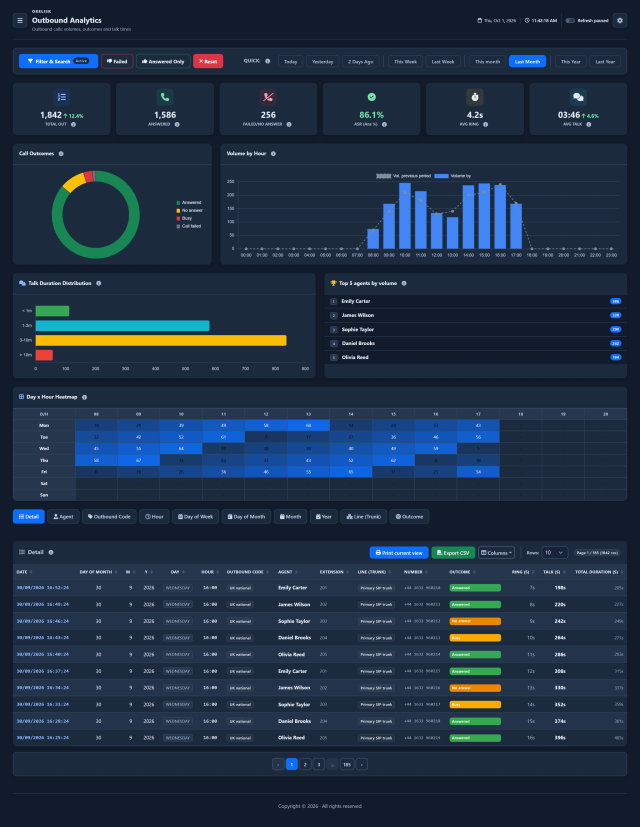
Slide the divider to compare the same workspace.
DarkChoose what to analyse. Then how to read it.
A simple data warehouse principle: facts describe what happened, measures tell you how much, and dimensions organize the result. In the report, combine your period and filters, then choose the grouping that answers your question.
One report. Every available perspective.
Read the year month by month or compare agents, lines and outcomes. Keep the filters and change the view of call volumes, answer ratio and times.
Call details
Read individual outbound attempts with the agent, extension, line, outcome and call times.
By agent
Compare outbound attempts, ASR and ringing and talk times by agent.
By outbound code
Compare outbound attempts, ASR and ringing and talk times by outbound code.
By hour
Compare outbound attempts, ASR and ringing and talk times by hour of the day.
By day of month
Compare outbound attempts, ASR and ringing and talk times by day number within the month.
By day of week
Compare outbound attempts, ASR and ringing and talk times by day of the week.
By month
Compare outbound attempts, ASR and ringing and talk times by month.
By year
Compare outbound attempts, ASR and ringing and talk times by year.
By line
Compare outbound attempts, ASR and ringing and talk times by line.
By outcome
Compare outbound attempts, ASR and ringing and talk times by call outcome.
Facts and measures: what happened
Outbound call attempts are the recorded events. Their measures include volume, answer ratio, ringing time and conversation duration.
Dimensions: how to group it
Time, agent alias, outgoing code, line and outcome offer different ways to compare outbound activity.
Filters: where to focus
Choose the period, agent aliases, outgoing codes and line. Refine by extension or called number to isolate the traffic you need.
Same period. A different perspective.
One outgoing line, optionally one agent alias
One row for each month in the selected year, with the report measures summarized month by month.
One row per agent alias, with outbound volumes and outcomes for the same selected year.
Keep your selection and change the grouping to compare another dimension. Combine the filters to focus the same analysis further.
The controls, up close.
Search
Find a called number or extension. Combine agent aliases, outgoing codes and a line to focus on the traffic that matters.
Quick filters
Choose the period and switch between answered calls and failed attempts. Refine the results using day, hour and outcome filters.
Know what to look for.
Outbound activity at a glance
Read total calls, answered and unsuccessful outcomes, answer ratio (ASR) and average ringing time. Average talk time refers to answered calls, helping you assess volume and conversation time together.
Outcomes and hourly volume
Compare answered, unanswered, busy and failed calls, then follow outbound volume by hour. The previous-period series helps you see how activity changes over time.
Duration bands and agent volumes
Explore the distribution by recorded talk duration and the five agents with the most outbound calls. Read volume together with outcomes and duration to assess how activity is distributed.
Outbound activity by day and hour
Locate the busiest outbound time slots at the intersection of weekday and hour. Use this view to compare calling patterns and plan the team’s activity.
Agent, line and outcome for each call
Inspect the agent, extension, outgoing line, dialled number, outcome and ringing, talk and total durations. Group and filter the results, choose columns and export or print your analysis.
Understand where the traffic goes. Decide where to optimise.
A busy line is a useful starting point for cost control. Read volumes, outcomes and times together to choose what to investigate with your telephony supplier.
Which line carries the most traffic?
Choose the Line grouping to compare call counts, answered calls, ASR, ringing and conversation times. Filter a line and compare periods to see how its use changes.
Explore traffic directions
Combine outgoing codes, called-number searches, agent and period. Outgoing codes are the codes recorded by your installation; their business meaning depends on your PBX configuration.
Make spending review measurable
Export the results and compare volumes and conversation times with supplier tariffs, bundles and invoices. Identify heavily used lines, repeated unsuccessful attempts and traffic worth reviewing before changing contracts or routing.
The report measures traffic. Cost in euros comes from your tariffs and billing rules, including call setup charges, rounding and bundles.
Compare traffic by lineRead the signal.
Choose the next step.
Read connection success alongside activity
An agent or line can generate many attempts with a modest answer rate. Group the same filtered period by agent and then by outbound line, comparing ASR with outcome distribution and talk duration to investigate where productive conversations begin and where attempts stop.
Group calls by outbound line or agent to see how activity and answer rates differ. Use detailed records and filtered exports for a closer operational review.
Put it to work
Filter by call start date, operator, extension, outbound code or line to isolate the activity you want to review.
Compare answered and failed calls, ASR, average ringing and average conversation on answered calls.
Switch between detailed records and grouped views, use charts to find volume patterns, and export the filtered result.
What you can do
From attempts to conversations
Outbound call volume, answered/non-answered outcomes, answer-seizure ratio and duration measurements.
Compare the right groups
Group by agent, accounting code, time, outbound line or outcome.
Find workload patterns
Distribution/volume charts, talk-duration buckets, top five agents and weekday/hour heatmap.
Refine the selection
Filter period, agents, lines, outcomes and other report dimensions.
Inspect and share records
Inspect detailed records; export filtered CSV and print current view.
Read the detail with confidence
Period follows CDR start time.
Period follows CDR start time.
ASR is ANSWERED/filtered total.
ASR is ANSWERED/filtered total.
What context matters?
Average ring estimate is duration minus talk across filtered records, including unanswered records.