

Global Dashboard
Explore service KPIs and trends, busiest hour, queue rankings, eleven charts, workload heatmap and complete queue statistics.
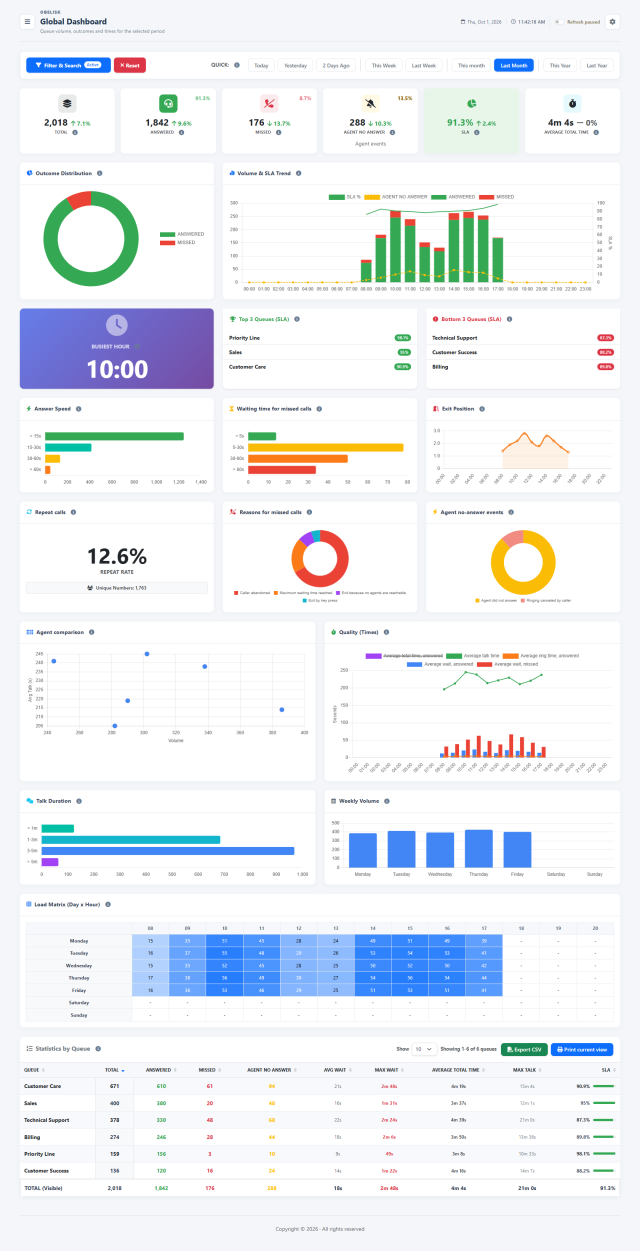
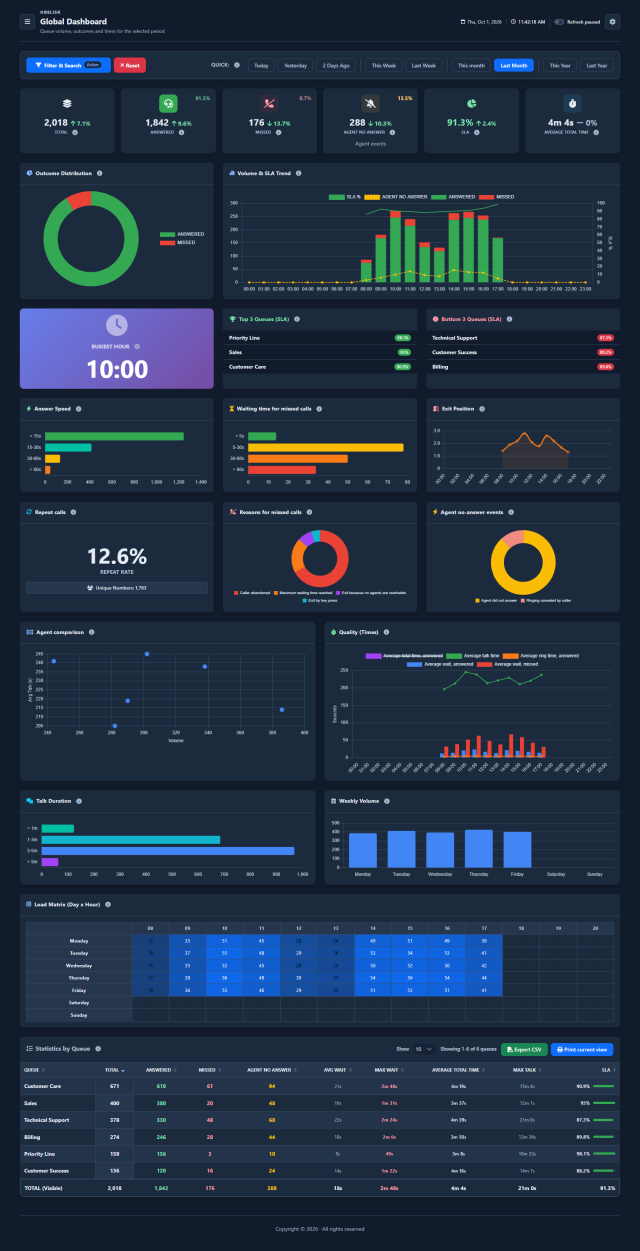
Slide the divider to compare the same workspace.
DarkKnow what to look for.
Service indicators and trends
Read answered and missed calls, agent attempts and service times with their trend against the previous period.
How many calls do we answer? How much time do they take?
Read service coverage at a glance.
In Global Dashboard, SLA shows the percentage of answered calls out of answered plus missed calls for the selected period and queues. A higher share means more incoming calls reached an agent.
This indicator measures the outcome, without a time threshold. Read it alongside Answer speed to understand how quickly customers receive a response. Agent no-answer attempts have their own counter and are separate from this denominator.
The arrow beside SLA compares its relative percentage change with the previous period. The Volume & SLA chart shows the answered share hour by hour. The interactive example here uses illustrative values to explain the formula.
Time matters. The reason for the call matters too.
Every minute of conversation uses team capacity and contributes to operating costs. For a quick-information service, making answers easier to find and reducing unnecessary steps can free time for the next caller. A complex support request may need a longer conversation to reach a useful solution.
Global Dashboard calculates AHT as average waiting plus conversation time for answered calls. Ringing is already included in waiting; after-call work is not part of this indicator. Read the waiting and conversation components separately to distinguish customer delay from time spent speaking with an agent.
- Waiting, including ringing
- 30 s
- Conversation
- 210 s
- Total time
- 240 s
For the report, Obelisk averages this total across answered calls. Compare similar services and periods, then check call outcomes and repeat contacts.
Outcomes, volume and service level
Connect call outcomes, hourly volume, agent no-answer events and the answer ratio on the complete daily timeline.
Peak hour and queue performance
Identify the busiest hour and compare the three queues with the highest and lowest answer ratios.
See where waiting turns into a missed opportunity.
Answer speed
See how answered calls are distributed across waiting-time bands: up to 15 seconds, 15–30, 30–60 and over 60. Identify whether most callers receive a quick response or a longer wait is becoming common.
Waiting before a missed call
Read how long missed calls waited before leaving the queue: up to 5 seconds, 5–30, 30–60 and over 60. Combine this distribution with the exit reasons to decide where coverage or routing deserves a closer look.
Exit position
The hourly line shows the average queue position at exit for missed calls. Repeated exits near the front of the queue are worth reading alongside waiting times, staffing and routing rules.
Understand what brings the caller back.
Repeat calls
The rate counts calls beyond the first for each identifiable number in the selected period and queues: (calls − unique numbers) ÷ calls × 100. A rise is a useful signal for investigating repeated contact.
Reasons for missed calls
Distinguish caller abandonment, maximum waiting time, exit because no agents are reachable and exit by key press. Each outcome points to a different operational question.
Agent no-answer events
Inspect the recorded causes, such as an agent not answering or the caller cancelling during ringing. These are attempts towards agents: several attempts can belong to the same incoming call.
Turn repeat contacts into better service.
First Call Resolution asks whether the customer’s need was solved in the first call. The repeat-call rate is a starting signal, not an automatic FCR score: the same number may call about a new issue, on behalf of another person or for an agreed follow-up. Read the contact history and the content of the conversation before drawing a conclusion.
Agents and service times
You may have agents who take many calls with short conversation times and others who take few calls with long conversation times. Quality and quantity help you identify anomalies in how calls are handled.
Match the time calls need with the people available.
Conversation duration
The duration bands show how answered calls are distributed: up to 1 minute, 1–3, 3–5 and over 5 minutes. Compare the mix with the type of service: a quick-information queue and a technical-support queue can have very different, equally useful conversations.
Weekly volumes
Read answered plus missed calls grouped by day of the week across the selected period. Combine this demand pattern with conversation duration and the day/hour heatmap to review shifts and coverage at the busiest times.
Workload across the week
Find the combinations of weekday and hour with the most calls.
One table. The detail behind every result.
Compare total, answered and missed calls, agent no-answer events, average and maximum waiting, average total time, maximum conversation duration and SLA. Sort the columns to find the queues you want to review first.
Open the calls behind the number
In Obelisk, the Answered, Missed and Agent no-answer counts open their detailed report with the queue and dates already selected. Move from a queue-level change to the records that explain it.
Bring the review to your team
Choose the number of rows to show, read the totals for the visible queues and export CSV or print the current view. Use a shared period and queue selection to make operational comparisons meaningful.
Read the signal.
Choose the next step.
Find the pressure before moving people
If missed calls rise on Monday morning, compare incoming volume, the hourly chart and the day/hour heatmap. Check whether the change affects one queue or several, then open the detailed report. This gives the team leader a clearer basis for reviewing coverage instead of reacting to a single headline number.
Use each KPI for the decision it supports
Global Dashboard SLA measures the answered share, without a time threshold. Its global AHT includes waiting plus conversation for answered calls. Read the separate response-speed views when speed matters, and use conversation plus after-call work when setting the staffing simulator. Keeping these definitions distinct makes comparisons meaningful.
Bring the evidence into the staffing review
Compare queues and periods, investigate outcomes and discuss the findings with the team. Export or print the selected report, then move to Workload and forecasts to test staffing alternatives for the hours that need attention. Historical reporting explains the pattern; simulation helps you explore a response.
Start with the hours and queues where demand and missed calls concentrate. Follow the pattern into the detailed report, then use Workload and forecasts to compare coverage alternatives before making a staffing decision.
Put it to work
Filter dates and queues, compare answered and missed volumes with the previous period, and read service outcomes alongside incoming demand.
The Global Dashboard SLA is the answered share: answered / (answered + missed), without a time threshold. Ring-no-answer attempts are shown separately from incoming volume.
Read the global AHT as average total waiting plus conversation time for answered calls. Ringing is already part of waiting; this measure is not the simulator's talk-plus-after-call input.
Use hourly trends, weekday volumes and the day/hour heatmap to identify recurring peaks and the time bands worth reviewing for coverage.
Explore response-speed and caller-patience distributions, exit positions, missed-call reasons and ring-no-answer causes before deciding where to intervene.
Compare agent call volumes and conversation times alongside repeat-call patterns to add context to a team review.
Review top and bottom queues, then open the detailed reports from the queue table to examine the calls behind a change.
Customize the report layout, export CSV or print the selected view for the next operational or staffing review.
What you can do
See demand and service together
Filter dates and queues, compare answered and missed volumes with the previous period, and read service outcomes alongside incoming demand.
Interpret each KPI correctly
The Global Dashboard SLA is the answered share: answered / (answered + missed), without a time threshold. Ring-no-answer attempts are shown separately from incoming volume.
Understand the time behind the result
Read the global AHT as average total waiting plus conversation time for answered calls. Ringing is already part of waiting; this measure is not the simulator's talk-plus-after-call input.
Find the hours that need attention
Use hourly trends, weekday volumes and the day/hour heatmap to identify recurring peaks and the time bands worth reviewing for coverage.
Explore how callers experience the queue
Explore response-speed and caller-patience distributions, exit positions, missed-call reasons and ring-no-answer causes before deciding where to intervene.
Put agent activity in context
Compare agent call volumes and conversation times alongside repeat-call patterns to add context to a team review.
Move from a queue comparison to its evidence
Review top and bottom queues, then open the detailed reports from the queue table to examine the calls behind a change.
Share the operational picture
Customize the report layout, export CSV or print the selected view for the next operational or staffing review.
Read the detail with confidence
Here SLA means Answered/(Answered+Missed), with no time threshold.
Here SLA means Answered/(Answered+Missed), with no time threshold.
Incoming volume excludes ring-no-answer attempts.
Incoming volume excludes ring-no-answer attempts.
Average total time means wait+talk for answered calls
Average total time means wait+talk for answered calls; ringing is already inside waiting.
What is included?
Repeat-call rate is a share of calls after the first, not the Contacts and journeys repeat-contact percentage.