

Move between queue sections, filter agent states and hide queues you do not need. Keep the workload and available agents in view as demand changes.
Wallboard · Live operations
Keep your queues.
In clear view.
A compact view of callers and agents, with the queue signals that keep supervisors oriented. See what is waiting, who is available and where attention is needed.
Interactive examples and complete product screenshots.
Interactive example
930
Stable
Customer Care
+44 20 7946 012801:12Priority: 0
+44 20 7946 017400:38Priority: 0
Olivia Reed 2101Free
Jamie Patel 2102Talking
Alex Morgan 2103Paused
Try a queue condition
Read the signal. Open the detail. Take the next action.
Queues and agents together
Shared sections and filters
Personal waiting and inactivity alerts
Dedicated Display accounts
Put it to work
Expand the waiting-caller list to see each caller, elapsed waiting time and priority above the agent list. Collapse it when you no longer need that detail.
Interact with agents and their live states: pause or resume an agent in the selected queue, or remove a dynamic membership, according to your permissions.
Open the headset control beside an agent to support a conversation through listening, coaching or a conference. Use your supervisor extension and the modes available to your account.
In your Preferences, personalise alert thresholds for waiting-call count, caller waiting time and agent inactivity. Filter the view and collapse caller details to keep only the information you need in focus.
Keep a shared screen on authorized live views using a read-only Display session with a configurable maximum duration.
Inside Obelisk
Wallboard
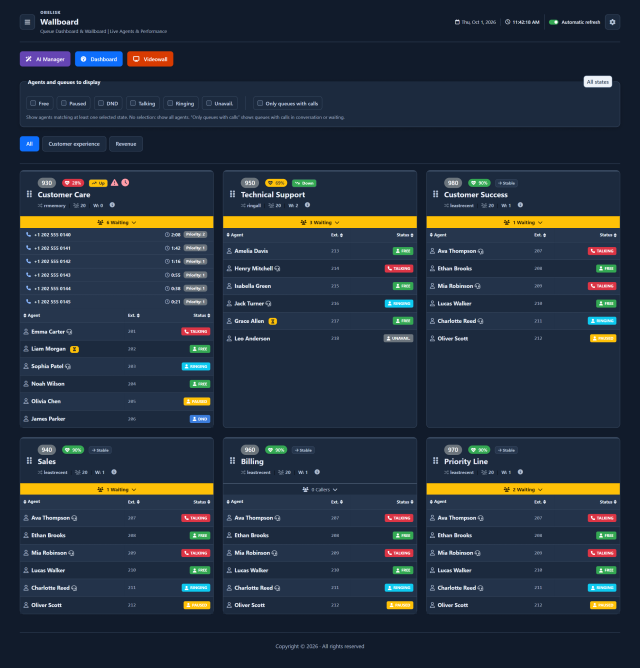
Monitor the workload in a compact view of queue health, waiting callers, elapsed waits and agent availability.
Scroll inside the frame to explore the complete screen.
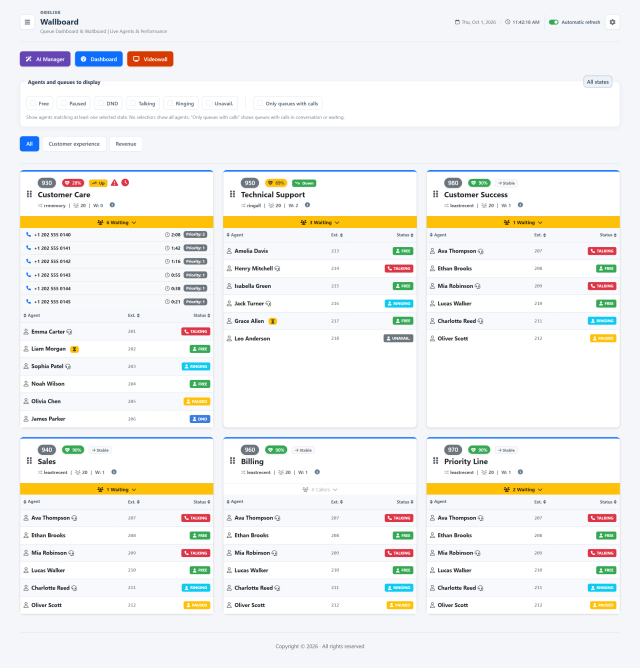
Light
Slide the divider to compare the same workspace.
Dark Scroll inside the frame to explore the complete screen.
Light
Slide the divider to compare the same workspace.
DarkFollow the details
Know what to look for.
1
Waiting callers and agents
Expand the caller list to inspect waiting time and priority alongside agent states, then collapse the details or hide queues you do not need. Set personal waiting-call, waiting-time and inactivity thresholds in Preferences. Pause or resume an agent, remove a dynamic membership or open the headset control for listening, coaching or a conference, according to your permissions.
More views and details 1
Support an agent during a call
Click the headset icon beside an agent who is on a call to open live supervision. Enter your supervisor extension and choose Listen to hear the conversation, Coach to speak to the agent, or Barge to join a conference, according to your permissions.
In practiceRead the signal.
Read the signal.
Choose the next step.
Choose the right level of detail
Wallboard keeps queue headers, waiting callers and members close together. Use it for continuous supervision of several queues; open Dashboard when you need its expandable statistics and charts. The two views share the live picture and retain their own access permissions.
01A compact working view.
A compact working view.
All the important context.
Keep waiting callers and agents in one compact view. Read queue health and recent waiting trends, open a caller list and use the controls available to your account.
02Someone is waiting.
Someone is waiting.
Open the detail.
The Wallboard brings the caller list one click away. Its amber disclosure moves gently when callers are waiting, making the queue easy to notice.
Interactive example
Customer Care
+44 20 7946 012802:15Priority: 1
+44 20 7946 017401:12Priority: 0
+44 20 7946 018600:38Priority: 0
Open the caller list, then switch to an empty queue.
The detail behind the count
Expand the button to inspect each caller’s displayed number, elapsed waiting time and priority. Caller identity follows the installation’s privacy settings.
When the queue becomes empty, the control is disabled and the list closes. The amber cue is a presence indicator. Red count and time alarms appear separately when the user’s enabled thresholds are exceeded.
Agent rows remain immediately available beneath the callers. Wallboard has no Dashboard Stats or Charts panels: its compact card concentrates on callers, agents and queue signals.
People, states and available capacity
Every color adds context.
The amber control opens the waiting-caller list. Read it alongside the agent rows to see who can respond, who is busy and which state needs attention.
The agent is available in the queue. Read availability alongside the live waiting count before deciding where help is needed.
Queue membership is paused. The pause badge can coexist with a phone state, so a paused agent may still be finishing a conversation.
Do Not Disturb is active. This is a phone availability condition, distinct from pausing membership in a particular queue.
A call is ringing on the agent’s device. Cyan draws attention to an offer that has not yet become a conversation.
The agent is on a call. Additional badges can distinguish a second incoming ring or a call on hold. Read the row for the precise condition.
Unavailable can include an invalid or unknown device state. Check the device and its registration: this badge alone does not prove that the agent is offline.
Who is waiting, and for how long?
Open the amber waiting-call control to move from the total to each caller. The list shows the displayed number, elapsed waiting time and priority. Agent rows remain available below, so you can connect each waiting situation with the capacity of the team.
Waiting count Elapsed wait Priority
The amber cue means callers are present; red count and time alerts follow your separate personal thresholds. An open list stays open during refreshes while callers remain. When the queue clears, the control is disabled and its list closes. Displayed caller identity follows the installation’s privacy settings.
Several badges, one agent
Paused Talking
A separate example: a free agent with an idle-time alert.
Free Idle alert
Pause and phone state describe different things, so both may appear on the same row. The yellow hourglass is a separate personal alert for an eligible free agent whose idle time exceeds your threshold; it is not applied to paused, DND or unavailable agents.
The action is beside the person.
Use the icons available to your account to act on queue membership. Obelisk asks for confirmation before sending a command to the PBX.
Pause in this queue
After confirmation, pause the agent’s membership in the selected queue. Read the tooltip for the pause reason and duration when the PBX provides them.
Resume queue activity
Resume a paused membership from the same row. The phone state remains visible, so you can check whether the agent is ready to receive calls.
Remove from this queue
Remove the agent’s membership after confirmation. Their extension and user account remain in place; the action applies to the selected queue.
A tooltip turns a status into a story.
Hover or focus an agent’s name to see the call count, time since the last call and queue login. When the PBX provides them, the tooltip also shows the pause reason and its duration. Idle time uses the last call, falling back to queue login when needed; queue login is not necessarily the start of a shift.
The headset icon opens live supervision. Depending on permissions and availability, use Listen, Whisper or Barge through the supervisor extension.
03The health of a queue.
The health of a queue.
At a glance.
The heart badge combines queue pressure and available capacity into a score from 0 to 100. A lower score is a prompt to look more closely.
Interactive example
80%
Room to respond
Move the controls to see each contribution to the score.
80–10050–790–49
Four signals, one useful summary
Waiting calls reduce the score. An average hold time above the configured reference adds a penalty. Having members but no free agent adds another. A service level below its reference reduces the score too.
The example uses the shipped default parameters: start at 100, subtract 10 per waiting call, one point per second of hold time above 30 seconds, capped at 20 points, 20 when no agent is free, and 30 when service level is below 80%.
What the score tells you
Health is an operational composite, not an SLA percentage or an AI prediction. Its rules are installation settings; personal alert thresholds do not change them. The badge’s own tooltip reports the score, for example “Health: 80/100”. The expanded breakdown here explains that calculation.
Average hold time comes from the PBX queue statistics. It is different from the longest current caller wait used by the personal time alert.
04Is the queue above
Is the queue above
its usual pressure?
Read the trend beside the health score. It compares the number of calls waiting now with the average number waiting during the last hour.
Interactive example
Up
Waiting now3
1-hour average1.2
Difference+1.8
Calls waiting · explanatory comparison
Past hour samples1-hour averageNow
Up
Amber means the current queue exceeds its last-hour average by at least the configured upper threshold. The shipped default is +1.5 calls.
Stable
Neutral means the difference lies between the configured thresholds. Stable does not necessarily mean an empty or healthy queue.
Down
Green means the current count is at least 0.5 calls below the average with default settings. It signals lower pressure than the recent baseline.
A comparison, not a forecast. This Dashboard / Wallboard badge does not use linear regression. Obelisk uses regression in its separate queue-load forecasting features. With insufficient history, the badge is a neutral minus; the native tooltip explains that history is unavailable.
05People behind the numbers.
People behind the numbers.
Controls where you need them.
Read an agent’s state, inspect their recent activity and take a permitted queue action without leaving the view.
Interactive example
Customer Care · 930
Agent controls
Hover or focus an agent name. Try Pause, Resume or Remove.
This action changes this example only.
Pause, resume, remove
The pause icon asks for confirmation before pausing the agent’s membership in the selected queue. The play icon resumes it. The tooltip shows the pause reason and elapsed duration when the PBX provides them.
The bin removes that membership from the selected queue after confirmation. It does not delete the person’s extension or user account. These controls appear only when the signed-in account has the corresponding action permission. In the product, they open a browser confirmation before the command is sent.
Hover an agent’s name for Calls, elapsed time since the Last call and queue Login. A free agent with a long idle interval can also carry the yellow hourglass badge.
Read more than one state
Pause can appear alongside a phone state. Other badges distinguish Free, DND, Unavailable, Ringing, Talking, In call + ringing and On hold.
Inspect and sort
Agent columns support sorting. The compact Wallboard table keeps the agent list directly in view; state filters reduce its rows.
Supervise a conversation
Where permitted and available, live monitoring offers Listen, Whisper and Barge through the supervisor extension entered in the monitoring dialog. These actions are separate from queue membership controls.
06Your thresholds.
Your thresholds.
Your early warning.
Set personal alerts in Preferences, then recognise the same signals in Dashboard and Wallboard. Each alert has its own switch and threshold.
Interactive example
Preferences example
Queue alerts
Example now: 3 waiting · longest wait 75s · agent idle 420s
Raise a threshold or switch an alert off. The corresponding icon disappears.
Too many waiting calls
A blinking red triangle appears when the waiting count is strictly greater than your enabled count threshold.
A caller has waited too long
A blinking red clock marks a longest current caller wait strictly above your time threshold. Both red icons can appear together.
A free agent has been idle
A yellow blinking hourglass marks an eligible free agent whose idle interval exceeds your threshold. It uses time since the last call, falling back to queue Login when needed. Paused, DND and unavailable agents are excluded. Queue Login is not necessarily the start of a work shift.
Presence is not an alarm. The amber caller-disclosure button is active as soon as someone is waiting. Red threshold alerts are additional signals. The example deliberately enables them with low limits. Shipped personal defaults are count alert off / 999 calls, caller-wait alert off / 3,600 seconds, and idle alert on / 300 seconds. Your saved account preferences may differ.
07Make room for the queues
Make room for the queues
that matter to you.
Switch sections, reorder queue cards and combine live filters. Keep the working view focused while retaining the full queue context.
Interactive example
Drag a card by its grip, or use its left / right buttons. Try a section and a state filter.
Sections organise the installation
An administrator creates named sections and assigns queues in Administration. The section pills then switch between those configured groups. They do not create or edit sections from the live screen.
Try a section setup example
This illustrates the administrator’s setup. The new pill appears in the example above.
Your card order follows you
Use the grip to move queue cards. The saved personal queue order is shared between Dashboard and Wallboard and takes priority over the configured section order. It changes the presentation, not PBX call routing.
Two filters, two different jobs
State checkboxes filter agent rows using “match any selected state”. No selections means all states. The All states button clears those selections and also turns off the active-queue filter. “Only queues with calls” filters whole queue cards using actual waiting or queue-correlated talking calls. An agent busy on an unrelated call does not alone make the queue active.
Live, with clear boundaries. State filters apply for the current browser session. The active-queue filter and personal queue order are saved account preferences. Unknown queue activity is kept visible rather than guessed to be empty. Queue totals remain queue totals even when some agent rows are filtered out.
08AI Manager.
AI Manager.
Support for your next decision.
Give Team Leaders a clearer reading of the contact center, from the first signal to the next intervention.
Analysis when you need it
From live data to team priorities.
At your request, AI Manager analyses the contact center’s live situation: queues, waiting times and agent availability. It draws on historical context when available and suggests priorities and practical interventions to consider.
The Team Leader weighs the suggestions and chooses how to act.
Explore AI ManagerAI Manager is optional and uses Gemini with your own API keys. Usage follows your account’s terms and charges. Wallboard, live supervision and local forecasts remain available without AI.
Connect the signals
Read current queues, waits and agent availability together. When available, the last hour’s activity and weekly history add context to the operational picture.
Set your priorities
Review the tactical suggestions to decide where to strengthen coverage, how to coordinate breaks and which checks to make first. Put your knowledge of the team alongside the analysis.
Follow the outcome
After an intervention, review the waiting-caller list, elapsed waits, agent availability and queue-health signals in Wallboard. Request a new analysis when you want an updated reading of the situation.
09From a signal
From a signal
to a useful next step.
Keep the view understandable as the shift changes.
1. Choose your scope
Open the section you need. Use “Only queues with calls” for an activity-focused pass; use agent-state checkboxes when you want to inspect a particular kind of availability.
2. Read pressure in context
Start with waiting callers, health and the last-hour comparison. Inspect the caller wait or agent tooltip before deciding what needs intervention.
3. Act with the right permissions
Pause, resume or remove a queue membership when appropriate, or open live supervision. Queue visibility and action permissions control what each account can see and do.
Keep the data moving
Auto Refresh keeps the live view up to date. Turn it off when you want to inspect a stable screen, and turn it back on to resume updates. Connection or stale-data messages deserve attention: the last visible value is not always a fresh measurement.
Header shortcuts also open AI Manager for operational advice and Videowall for a room-scale view. Available shortcuts follow the account’s permissions.
Read the queue parameters
Small information icons offer contextual help: hover or focus to read, click to pin, and use Escape or click outside to dismiss. Agent tooltips and the short titles on badges provide their own focused explanations.
The small line below a queue name shows its distribution strategy, maximum waiting capacity and weight. The infinity symbol indicates no configured maximum. These explain the queue’s PBX settings; rearranging a card does not change them.
Personal where it should be
Saved account preferences keep queue order, active-queue filtering, hidden queues, alert thresholds and appearance choices consistent. Administrator configuration determines the available sections, queue labels, visibility and broader installation settings.
A clear companion to Dashboard
Use Wallboard for direct caller and agent visibility. Switch to Dashboard for its agent-state counters, expandable PBX statistics and activity pie charts. Both use the same queue health, trend and personal alert rules.
Continue the product tourMore detail.
Explore Dashboard