

Missed Calls
Understand unanswered queue exits through their reasons, wait distributions and individual call records.
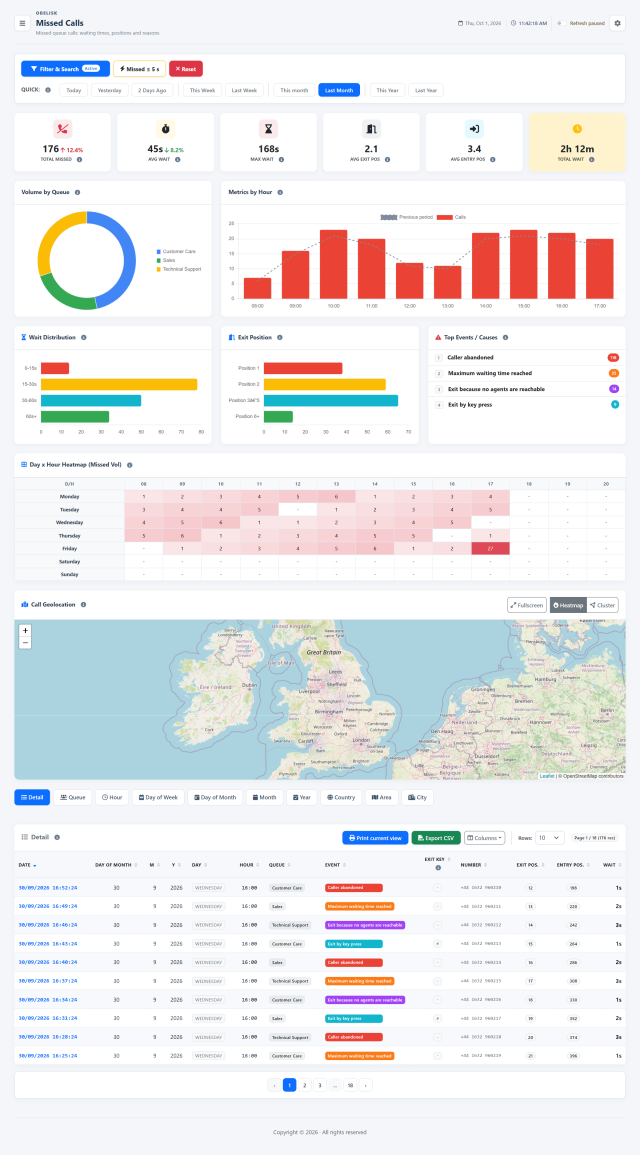
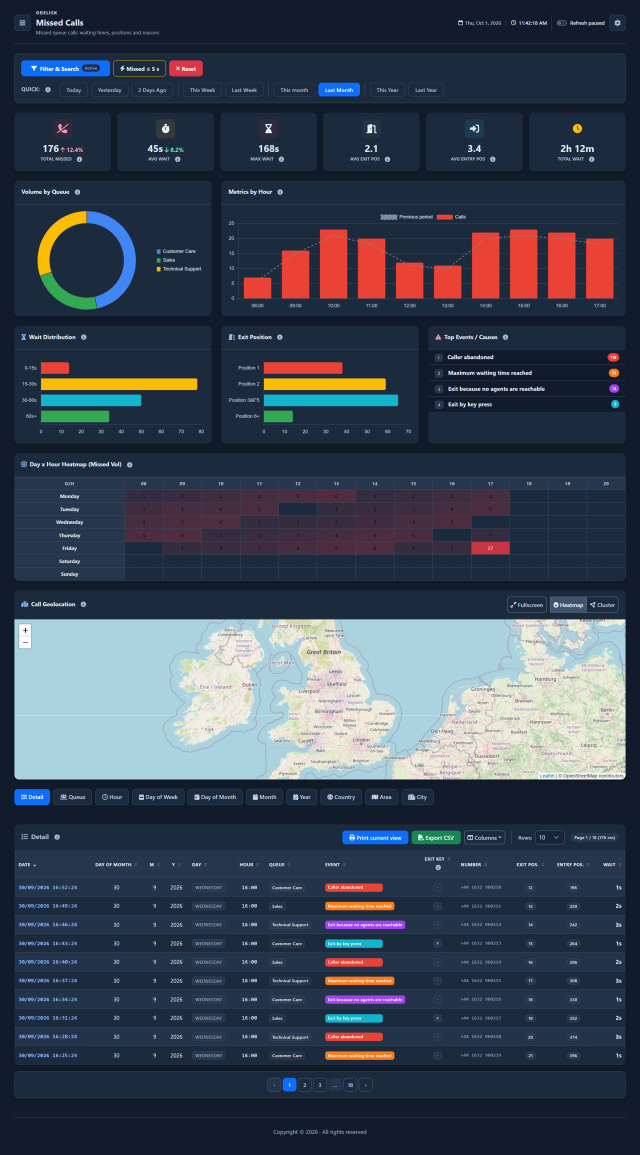
Slide the divider to compare the same workspace.
DarkChoose what to analyse. Then how to read it.
A simple data warehouse principle: facts describe what happened, measures tell you how much, and dimensions organize the result. In the report, combine your period and filters, then choose the grouping that answers your question.
One report. Every available perspective.
Compare queues or read the year month by month. Review missed-call volumes, waiting times and queue positions within the selection you defined.
Call details
Read individual missed queue calls with the exit event, waiting time and queue positions.
By queue
Compare missed call volumes, waiting time and queue positions by queue.
By hour
Compare missed call volumes, waiting time and queue positions by hour of the day.
By day of month
Compare missed call volumes, waiting time and queue positions by day number within the month.
By day of week
Compare missed call volumes, waiting time and queue positions by day of the week.
By month
Compare missed call volumes, waiting time and queue positions by month.
By year
Compare missed call volumes, waiting time and queue positions by year.
By country
Compare missed call volumes, waiting time and queue positions by the country associated with the calling number.
By area
Compare missed call volumes, waiting time and queue positions by the area associated with the calling number.
By city
Compare missed call volumes, waiting time and queue positions by the city associated with the calling number.
Facts and measures: what happened
Missed queue calls are the recorded events. Their measures include volume, waiting time and position in the queue.
Dimensions: how to group it
Time, queue and telephone geography organize the calls into groups you can compare.
Filters: where to focus
Choose a date range and one or more queues. Refine by number, call ID, geographic area or recorded exit event.
Same period. A different perspective.
The queues you want to compare
One row for each month in the selected year, with the report measures summarized month by month.
One row per queue, with missed-call volumes and waiting times for the same selected year.
Keep your selection and change the grouping to compare another dimension. Combine the filters to focus the same analysis further.
The controls, up close.
Search
Search by number or call ID and focus on the queues or geographic areas you want to investigate. Use calendar and event filters to define the selection.
Quick filters
Choose a preset period and highlight short waits. Combine it with day, hour and exit-event filters to understand when calls leave the queue.
Know what to look for.
Missed calls and waiting time
Read total missed calls, average and maximum wait, entry and exit positions, and total waiting time together. Trends help you compare the selected period with the previous one.
Queues and hours with the most missed calls
Compare the share of missed calls by queue and their hourly distribution. The previous-period series helps you distinguish recurring peaks from a change in demand.
Waiting, exit position and recorded reasons
Read waiting-time bands alongside the position at which customers leave and the recorded exit events: abandonment, maximum wait, key press or an empty queue. Together they help you choose where to investigate.
Missed calls by day and hour
The heatmap brings weekday and hour together. Stronger cells highlight the time slots with more missed calls, giving you a concrete starting point for reviewing coverage.
Geographic distribution of missed calls
Explore the areas associated with telephone prefixes using heatmap or cluster views. Compare this geographic context with the selected queues and period.
From a pattern to the individual call
Inspect date, queue, event, telephone number, entry and exit positions and waiting time. Choose detail or grouped views, select columns, then print or export the filtered results.
Read the signal.
Choose the next step.
Follow what happened after the queue exit
A timeout or a key press can end one queue visit while the same call continues elsewhere. Read the exit reason and waiting time here, then inspect the call in Queue Routing Log when you need to establish the later path and eventual answer.
Check whether a rise in missed calls comes from caller abandonment, timeout or unavailable agents. Then inspect the waiting buckets and hours most affected.
Put it to work
Select queues and dates to review abandonment, timeout, unavailable-agent exits and keypad exits.
Compare average, maximum and total waiting with entry and exit positions to understand the queue experience.
Explore causes, hourly heatmaps and telephone-prefix geography, then share the filtered detail through CSV or print.
What you can do
Measure queue exits
Missed volumes and wait/position measurements.
Separate the reasons
Separate caller abandonment, timeout, no reachable agents and exit by key press.
Find recurring patterns
Wait buckets, exit-position distribution, causes and weekday/hour heatmap.
Group the evidence
Detail and grouping by queue, time and telephone geography.
Add geographic context
Country/area/city filters and heatmap/cluster geography with fullscreen view.
Share the current view
CSV exports, current-view printing and saved layout preferences.
Read the detail with confidence
A missed queue call may continue and be answered elsewhere.
A missed queue call may continue and be answered elsewhere.
Counted per queue exit
Counted per queue exit; excludes individual agents' ring-no-answer attempts.
Period follows unanswered queue exit.
Period follows unanswered queue exit.