

Answered Calls
Explore answered calls through waiting times, conversation durations, queue totals and geographic aggregates.
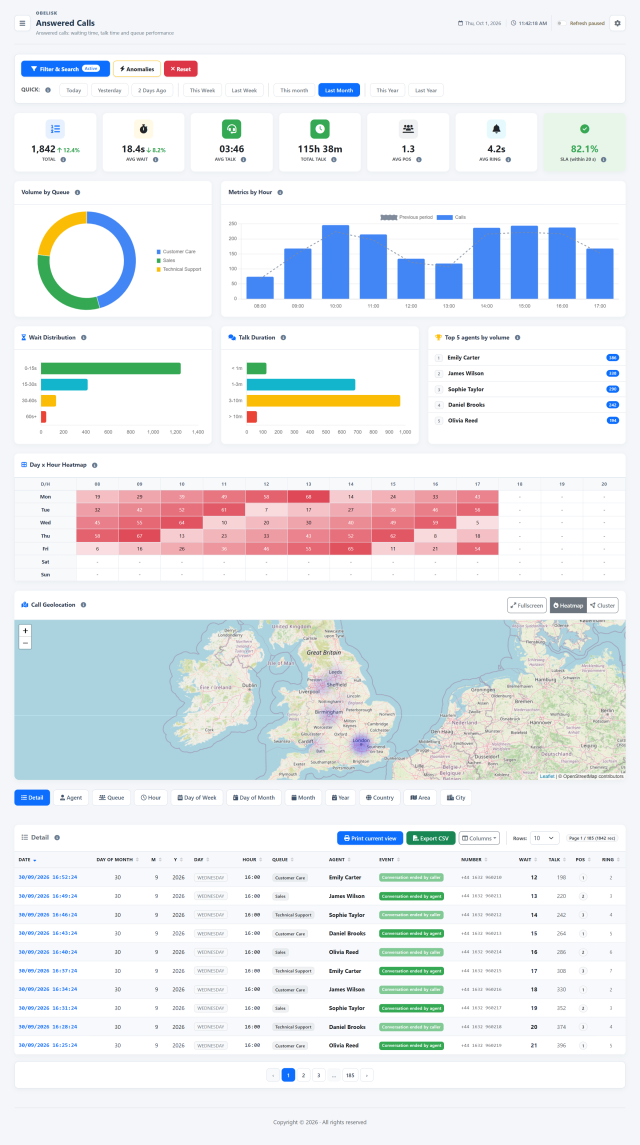
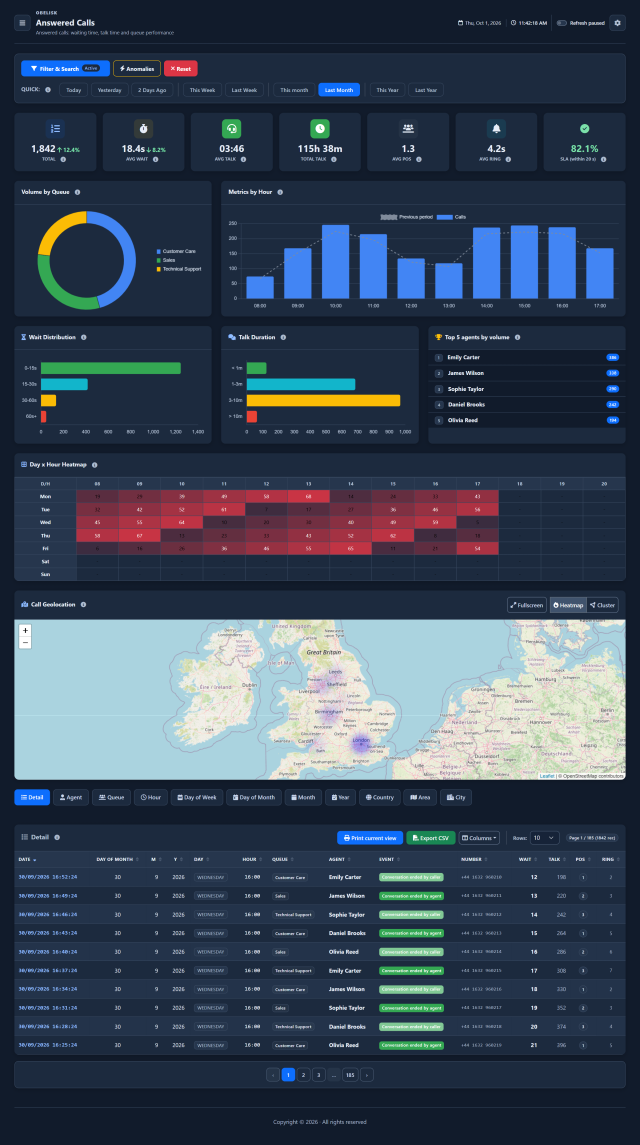
Slide the divider to compare the same workspace.
DarkChoose what to analyse. Then how to read it.
A simple data warehouse principle: facts describe what happened, measures tell you how much, and dimensions organize the result. In the report, combine your period and filters, then choose the grouping that answers your question.
One report. Every available perspective.
Read one year month by month, then switch to Agent or Queue while keeping your filters. Compare call volumes, waiting times and conversation durations for each group.
Call details
Read individual answered calls with their queue, agent, waiting time and talk time.
By agent
Compare answered call volumes, waiting time and talk time by agent.
By queue
Compare answered call volumes, waiting time and talk time by queue.
By hour
Compare answered call volumes, waiting time and talk time by hour of the day.
By day of month
Compare answered call volumes, waiting time and talk time by day number within the month.
By day of week
Compare answered call volumes, waiting time and talk time by day of the week.
By month
Compare answered call volumes, waiting time and talk time by month.
By year
Compare answered call volumes, waiting time and talk time by year.
By country
Compare answered call volumes, waiting time and talk time by the country associated with the calling number.
By area
Compare answered call volumes, waiting time and talk time by the area associated with the calling number.
By city
Compare answered call volumes, waiting time and talk time by the city associated with the calling number.
Where do your answered calls come from?
Compare telephone origin by Country, Area/Region and City. Choose a quick period or a custom date range, then combine geography with one or more queues and agents. The active selection feeds the KPIs, charts, map, result table and CSV export.
Compare answered volumes and waiting or conversation times across cities within that same selection. Switch the grouping to Area/Region for a broader view.
Refine the question with the other filters
Search by number or call ID; add year, month, day, day of the week, hour or recorded event. The short-call shortcut selects conversations under 10 seconds. These criteria combine with your period, queues, agents and geographic choices.
Telephone geography uses the most specific matching prefix. Country, area, city and map coverage depend on the available data; this describes telephone numbering, not a caller’s GPS position.
See the call mapFacts and measures: what happened
Answered calls are the recorded events. Their measures include volume, waiting time and conversation duration.
Dimensions: how to group it
Time, queue, agent and telephone geography give you different ways to organize the same calls.
Filters: where to focus
Choose a date range and one or more queues or agents. Add a number, call ID or geographic area to focus your analysis.
Same period. A different perspective.
One selected queue, optionally one agent
One row for each month in the selected year, with the report measures summarized month by month.
One row per agent, with the answered calls and times for the same selected year.
Keep your selection and change the grouping to compare another dimension. Combine the filters to focus the same analysis further.
The controls, up close.
Search
Find a call by number or call ID. Combine queues, agents and geographic selections with the period you want to examine.
Quick filters
Move from today to last year with the preset periods. Highlight short conversations, then explore waiting times and outcomes.
Know what to look for.
The service at a glance
Read answered volume, average waiting and conversation time, total conversation time, average queue position, ringing time and the share answered within 20 seconds. These measures follow the period and filters you selected.
Volumes and the selected dimension
In Detail, compare the distribution across queues and the hourly volume. Switch to Agent, Country, Area or City to read distributions and measures by that dimension. Use the chart legend to select the available series; the previous-period comparison appears in supported views.
Waiting, conversation length and agent volumes
Go beyond an average: see how answered calls fall into waiting-time and conversation-length bands. Alongside them, the five agents with the most answered calls help you read the distribution of activity. Their ranking is based on answered-call volume.
Find recurring peaks by day and hour
Cross the day of the week with the hour. Each heatmap cell shows answered-call volume for that combination within the active selection. Use the concentrations to investigate recurring busy periods, then refine by queue, agent or telephone geography.
Map the telephone origin of calls
Combine Country, Area/Region and City with your period, queues and other filters. Heatmap highlights concentrations; Cluster groups the available geographic points, whose popups show call counts. Expand the map for a wider view. Locations come from telephone-prefix data and the coordinates available for those prefixes.
Answered call details
Return to individual calls or group the same selection by agent, queue, time, country, area or city. Inspect waiting, conversation and ringing times, then choose columns, print the current view or export CSV for further analysis.
Read the signal.
Choose the next step.
Put the 20-second measure in perspective
If 80 of 100 answered queue calls waited 20 seconds or less, this measure is 80%. Use it with answered volume and the missed-call report to assess both response speed and the callers who left before reaching an agent.
Follow time from waiting to completion
Ringing already forms part of the queue wait, followed by conversation time after answer. The report assigns the call to the period in which that conversation ends. This makes the timing easier to interpret when a call crosses midnight or a reporting boundary.
Compare agent or queue groups, inspect the waiting-time distribution and isolate short conversations. Move between patterns and detailed call rows without losing the selected period.
Put it to work
Filter by period, queue, agent or telephone geography, then switch between individual records and grouped results.
Compare average waiting, talk time, total conversation and the share answered within 20 seconds; inspect available ringing-time coverage.
Find volume patterns through distributions, operator rankings, heatmaps and prefix-based maps, with CSV and print controls.
What you can do
Measure the answered experience
Answered volume, average wait/talk/ring, total talk, average entry position and 20-second service measure.
Choose the right dimension
Detail or group by agent, queue, hour, day, weekday, month, year, country, area or city.
See the shape of the workload
Wait and talk distributions, top five agents by volume and day/hour heatmap.
Explore telephone geography
Telephone-prefix geography with heatmap/cluster map and fullscreen inspection.
Narrow the question
Filter dates, queues, agents, geography and advanced time criteria; focus on calls under 10 seconds.
Take the evidence with you
Filtered CSV, current-view printing and account-saved panel/column preferences.
Read the detail with confidence
Period follows conversation end, not queue entry.
Period follows conversation end, not queue entry.
How should I interpret this?
The 20-second service measure is the share of answered calls with a wait of 20 seconds or less, out of all answered calls.
Ring is part of waiting and should not be added again.
Ring is part of waiting and should not be added again.
Maps infer telephone-prefix geography, not current physical location.
Maps infer telephone-prefix geography, not current physical location.
Top performers chart ranks volume, not quality.
Top performers chart ranks volume, not quality.