

Status
Connect contact registration and latency with device information and available geographic context.
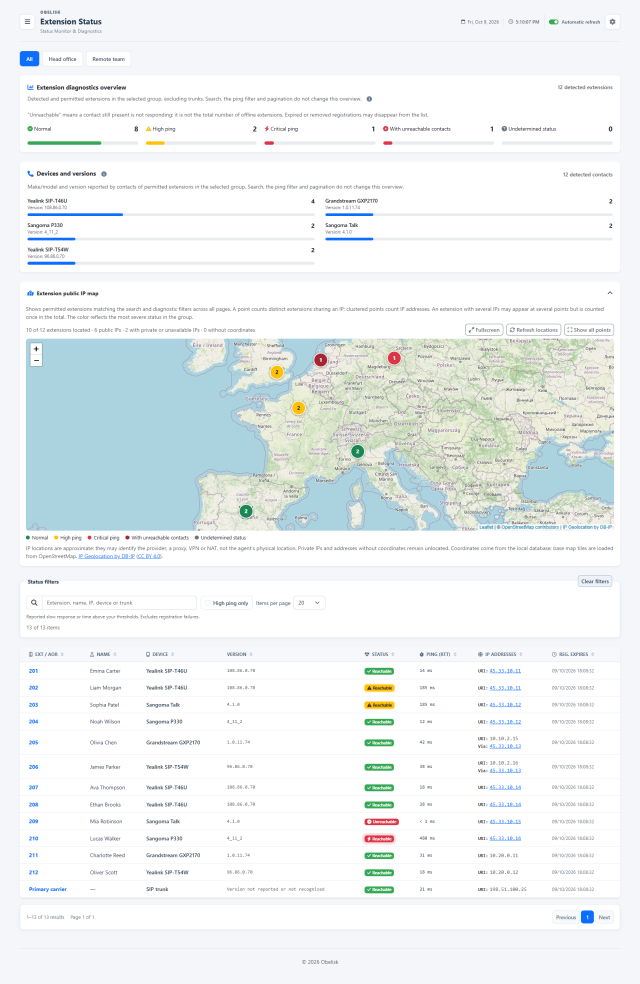
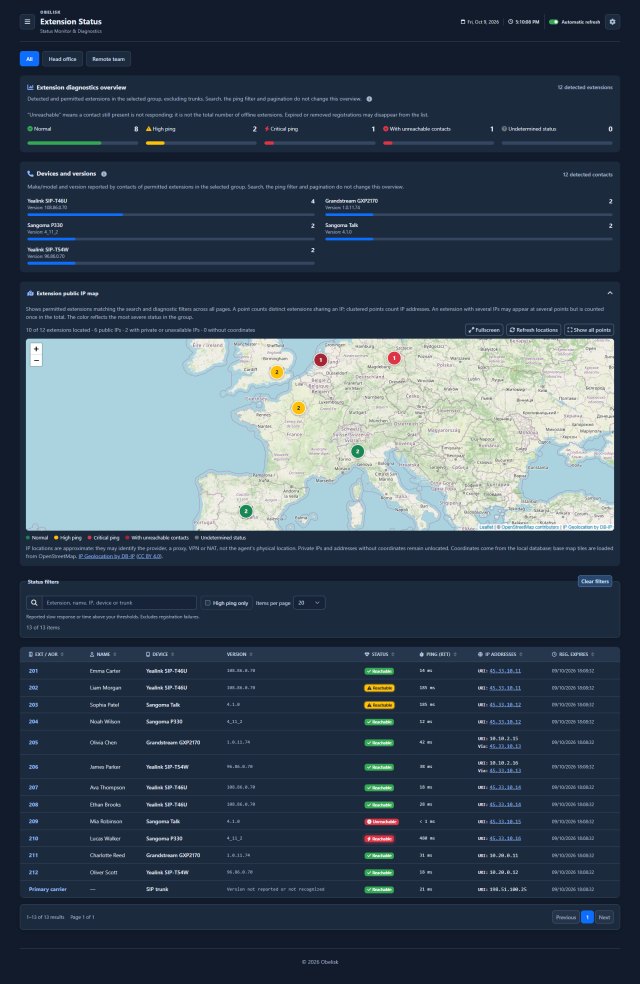
Slide the divider to compare the same workspace.
Dark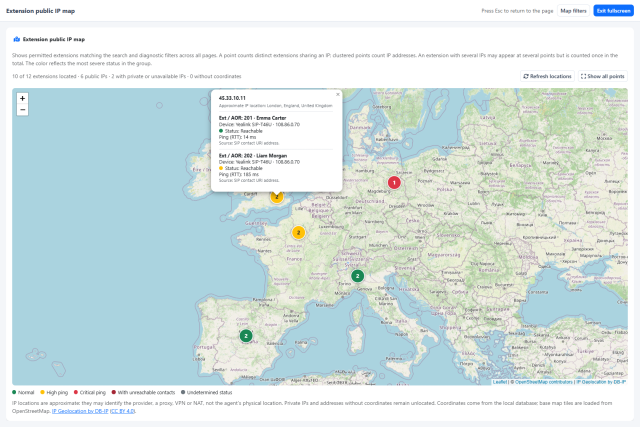
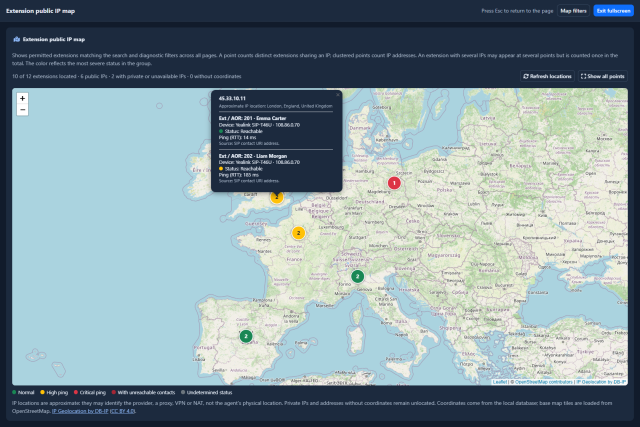
Slide the divider to compare the same workspace.
DarkKnow what to look for.
Registration diagnostics
Compare normal registrations, high latency, critical latency and unreachable contacts.
Devices by model and version
Compare desk phones and softphones by the make, model and firmware or software version reported by their registered contacts. The grouped counts highlight different versions of the same model and help IT identify the devices to review when planning updates.
Devices on the public IP map
Locate the public IP addresses of the visible extensions, then open a point to read the extension, device, reported version, registration state and response latency together. Coloured markers help you spot registrations that need attention and connections shared by several extensions.
The location is an approximate indication of the public IP’s network, useful for comparing sites and connections.
Make the signals work for your team.
Personal RTT thresholds
In Preferences, choose when response latency should attract your attention. Enable or disable warning and critical alerts independently and set each threshold in milliseconds.
These are the starting values. Your saved preferences define your alerts.
Explore personal PreferencesGroups, visibility and privacy
In Operational views, administrators organise Status into groups of extensions, choose which entries to show and control whether operator names are visible. Status has its own name-privacy setting.
The same administrative area brings together Dashboard and Wallboard queue sections, Monitor groups and Status groups. Each workspace keeps the visibility and privacy settings appropriate to its data.
Explore Operational viewsRead the signal.
Choose the next step.
One failed device stays visible
A person may register both a desk phone and a softphone. The overview counts the detected extension once and uses its most severe contact status, so a reachable device does not hide another device’s registration failure. Open the contact rows to identify which endpoint needs attention.
Compare devices and locations
Use device and version groups to look for a shared equipment pattern, then inspect the public-IP map for a shared network pattern. Together, the two views help you investigate whether affected registrations cluster around a phone version or a connection used by several extensions.
If agents report call issues, start with high-RTT or unreachable contacts. Inspect registration details and device versions, then compare whether the problem affects one endpoint or a wider group.
Put it to work
Compare the make/model and firmware or software version reported by registered SIP contacts. Grouped counts make different versions visible and help you identify devices to review before planning updates.
Read the contact round-trip time reported by Asterisk alongside its registration state. Personal warning and critical thresholds, coloured badges and the high-ping filter help you focus the investigation.
Start with the extension health overview, then inspect names, devices, IP addresses, reported versions and registration expiry. Groups, search and sorting help you narrow the issue to the contacts that need attention.
Read device, extension, IP address and response time together, including multiple contacts associated with one extension.
Search the table, select a group or filter high latency to focus on the endpoints that need attention.
Open the map for an approximate geographic view of public IP contacts, with the same resource visibility as the rest of the page.
What you can do
A diagnostic overview
Diagnostics overview: normal, high ping, critical ping, unreachable contacts and undetermined status.
Inspect individual contacts
Sortable contact table with extension/AOR, person, device, version, registration state, RTT, IP and registration expiry.
Understand the device mix
Distribution of reported device names and software versions, with expandable remaining categories.
Location with context
Map of permitted extensions and public-IP locations, clustered with diagnostic severity.
Focus on the exception
Search, groups, high-ping filter, pagination and pausable refresh.
Display sessions
Use a dedicated Display account for read-only access to authorized live views, with a configurable session duration.
See devices by model and version
Compare the make/model and firmware or software version reported by registered SIP contacts. Grouped counts make different versions visible and help you identify devices to review before planning updates.
Find slow or unreachable contacts
Read the contact round-trip time reported by Asterisk alongside its registration state. Personal warning and critical thresholds, coloured badges and the high-ping filter help you focus the investigation.
Move from the overview to the contact
Start with the extension health overview, then inspect names, devices, IP addresses, reported versions and registration expiry. Groups, search and sorting help you narrow the issue to the contacts that need attention.
Read the detail with confidence
What does this view measure?
The diagnostics overview counts each detected, permitted extension once. The contact table can contain several registrations per extension; extensions with no detected contacts are not included.
User-Agent data is reported by clients, not a certified physical-device inventory.
User-Agent data is reported by clients, not a certified physical-device inventory.
IP location is approximate
IP location is approximate; network registration is not availability to receive calls.