Demand by time slot
Call arrivals, volumes by queue and recurring peaks: see where the workload concentrates.
Bring together real-time operations, Business Intelligence, call journeys, quality and AI. Turn Asterisk and FreePBX data into operational KPIs, workload forecasts and staffing scenarios to guide your next decision.
OBSKObserve, Benchmark, Strategize, Know.
From live queues to colourful call flows and rich reports. Explore Dashboard, Wallboard, Videowall, Routing and Reports, with complete screens and a light/dark comparison in every view.
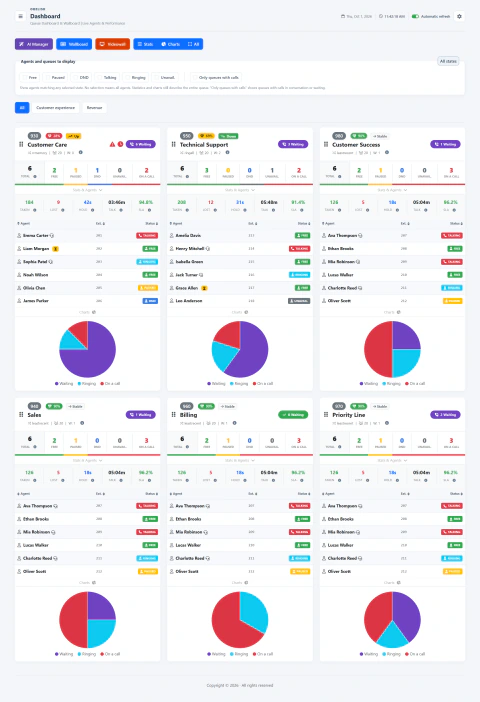
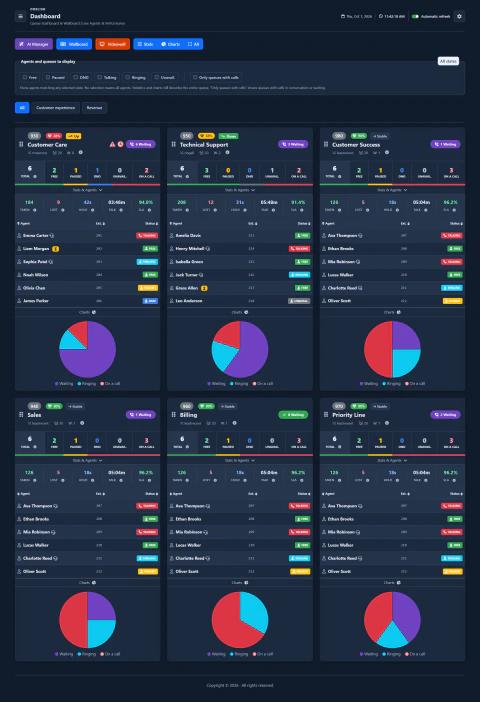
Slide the divider to compare the same workspace.
Dark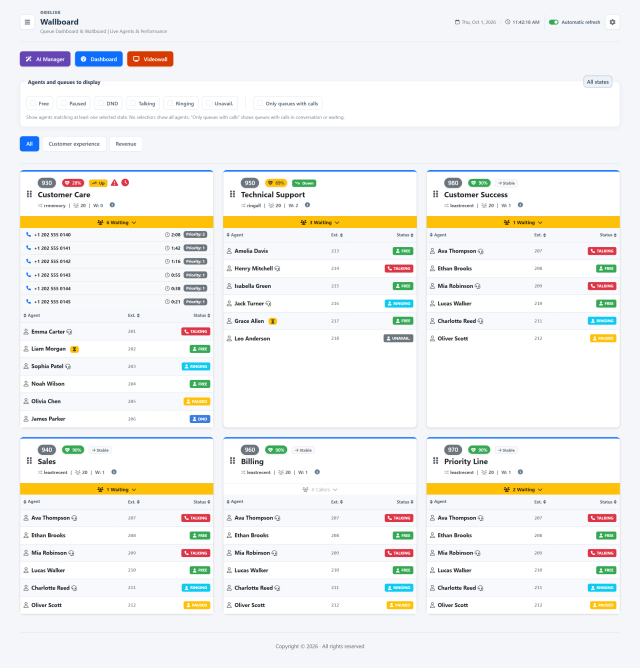
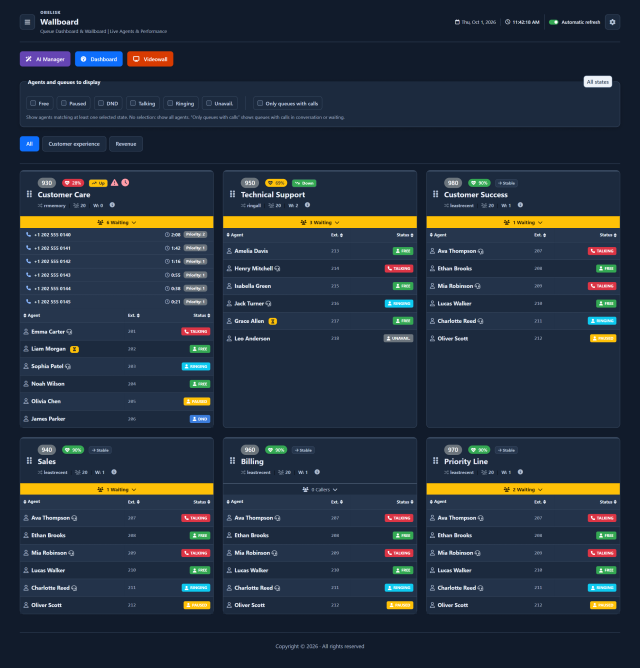
Slide the divider to compare the same workspace.
Dark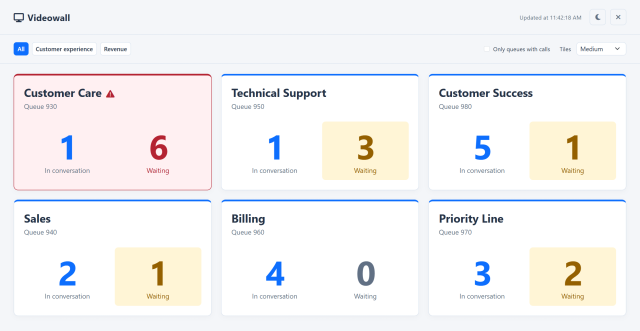
Slide the divider to compare the same workspace.
Dark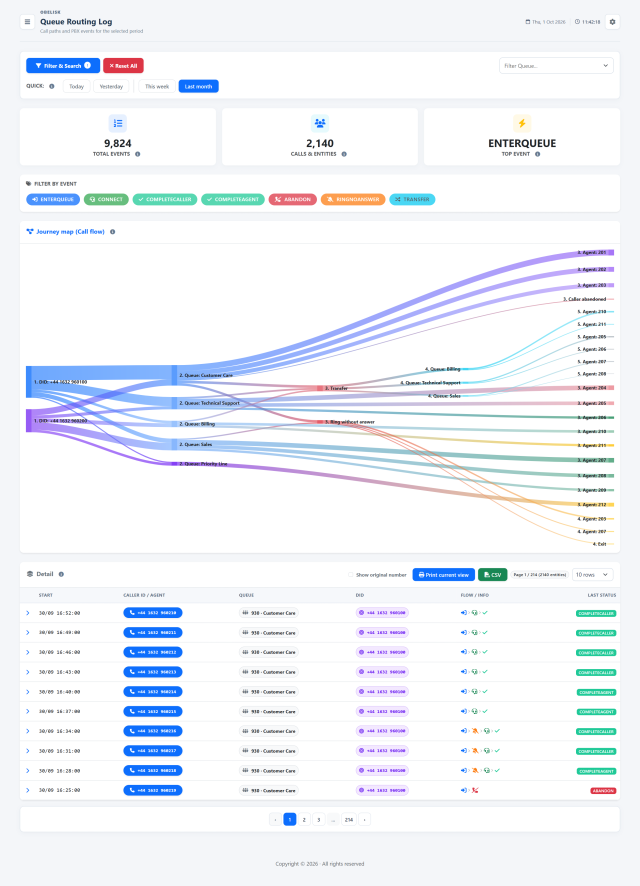
Slide the divider to compare the same workspace.
Dark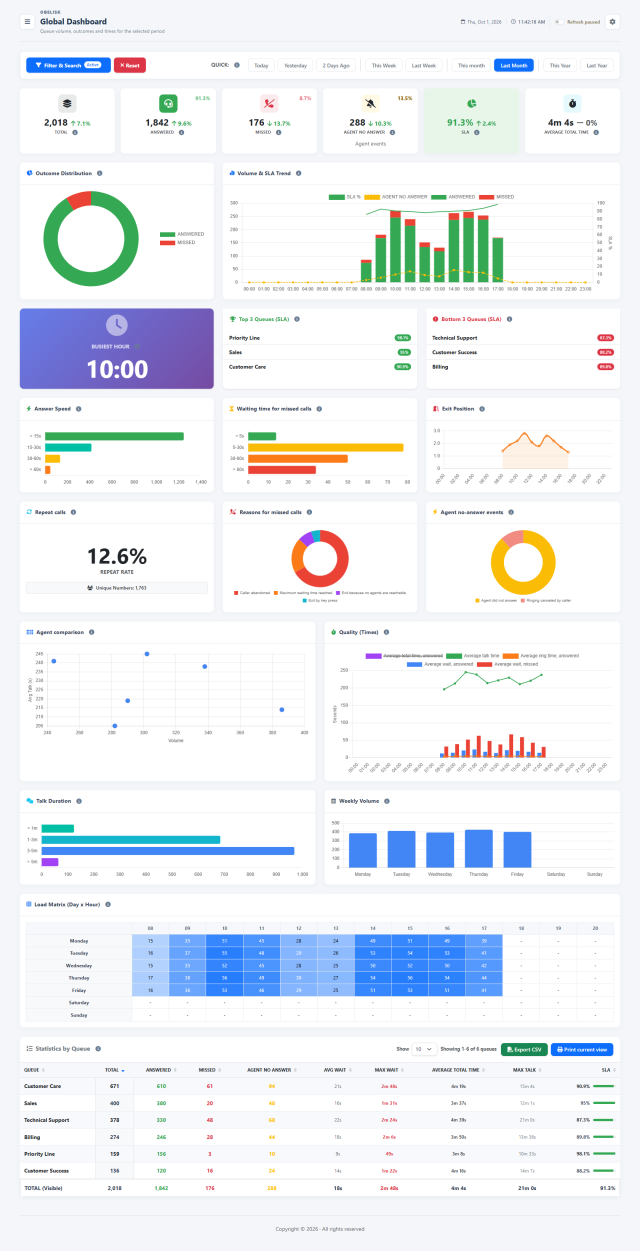
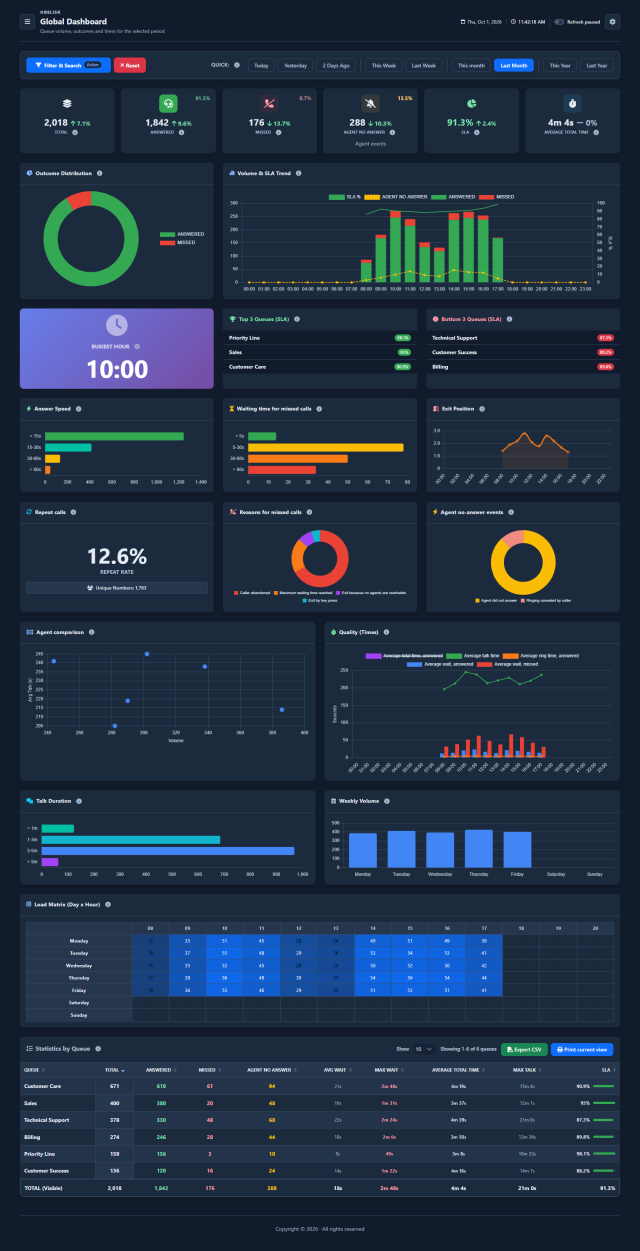
Slide the divider to compare the same workspace.
DarkAll the tools Team Leaders need to anticipate peaks and plan Contact Center staffing. Operational KPIs, workload analysis, call and agent quality analysis, forecasting, coverage simulations and more: Obelisk brings together the signals that support each decision.

Call arrivals, volumes by queue and recurring peaks: see where the workload concentrates.
Answered and missed calls, answer rate and repeat calls: connect demand with the customer experience.
Waiting and conversation times, heatmaps and agent activity help explain pressure on the team.
Estimate arrivals with 15, 30 or 60-minute profiles and compare forecast accuracy against historical results.
Compare required, scheduled and net available agents to identify time slots that need a different staffing plan.
Assess the estimated response-time target, occupancy and average wait before choosing a coverage scenario.
Compare queues, dates and time slots. Use KPIs and heatmaps to find recurring peaks and service pressure.
Explore the coming week, review historical forecast errors and choose the interval that fits your operation.
Vary demand, handling time, availability and staff by time band. Save scenarios and compare A/B before deciding how to distribute your team.
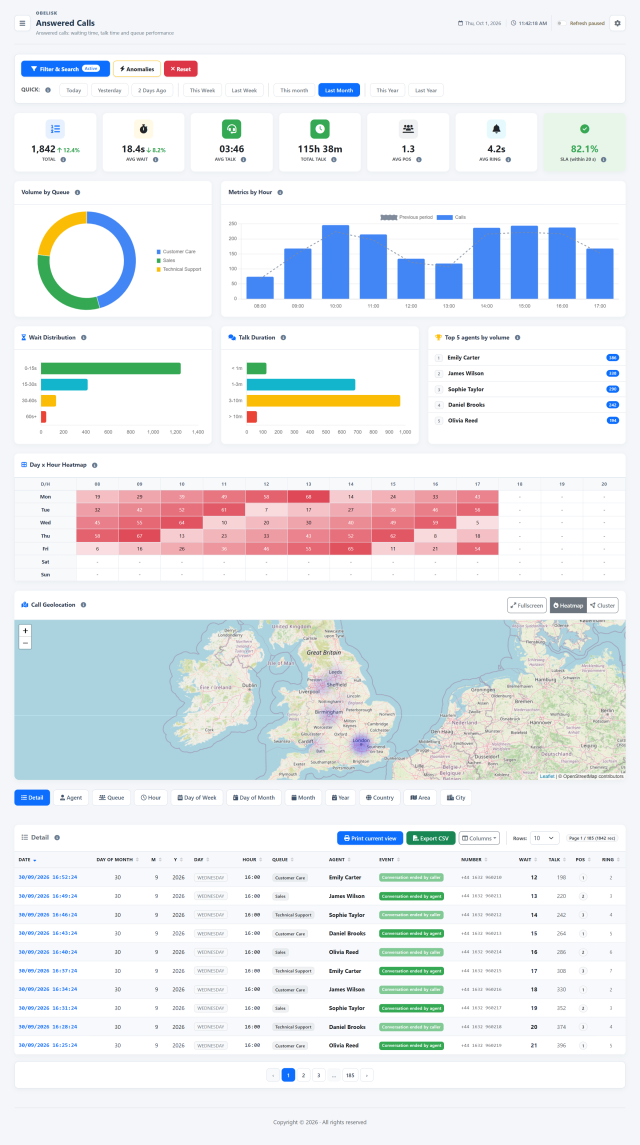
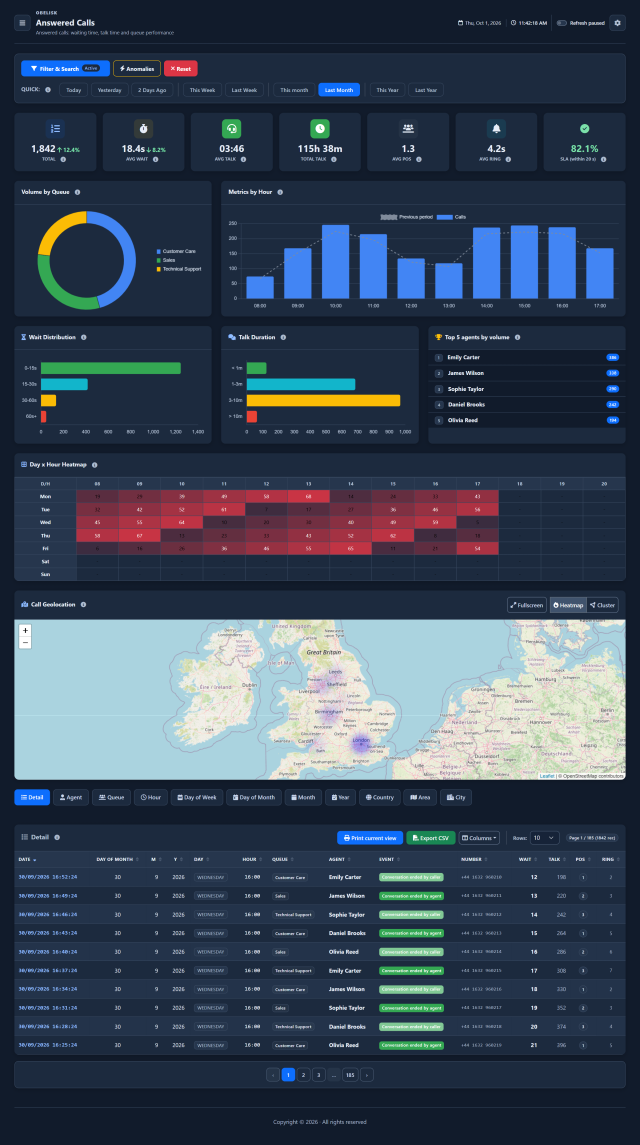
Slide the divider to compare the same workspace.
Dark

Slide the divider to compare the same workspace.
DarkSlide the divider to compare the same workspace.
DarkTry different staffing levels against the same traffic, include after-call work and an allowance for unavailable time, then compare coverage gaps, estimated waiting and occupancy. Use the results to decide where to reinforce coverage and how to distribute staff across queues and time slots.
Forecasts and coverage simulations run locally, without Gemini. Simulations support planning; Team Leaders retain control of schedules and assignments.
When waiting calls build up, turn the numbers into a clearer course of action. From Dashboard or Wallboard, ask AI Manager to analyse the current Contact Center situation and help you identify what needs attention first.
Compare waiting pressure with available capacity in other queues. Review suggestions on where to reinforce coverage and how to time breaks, using the operational context in front of you.
On-demand analysis with optional Gemini AI and your own API keys. The Team Leader chooses the action.
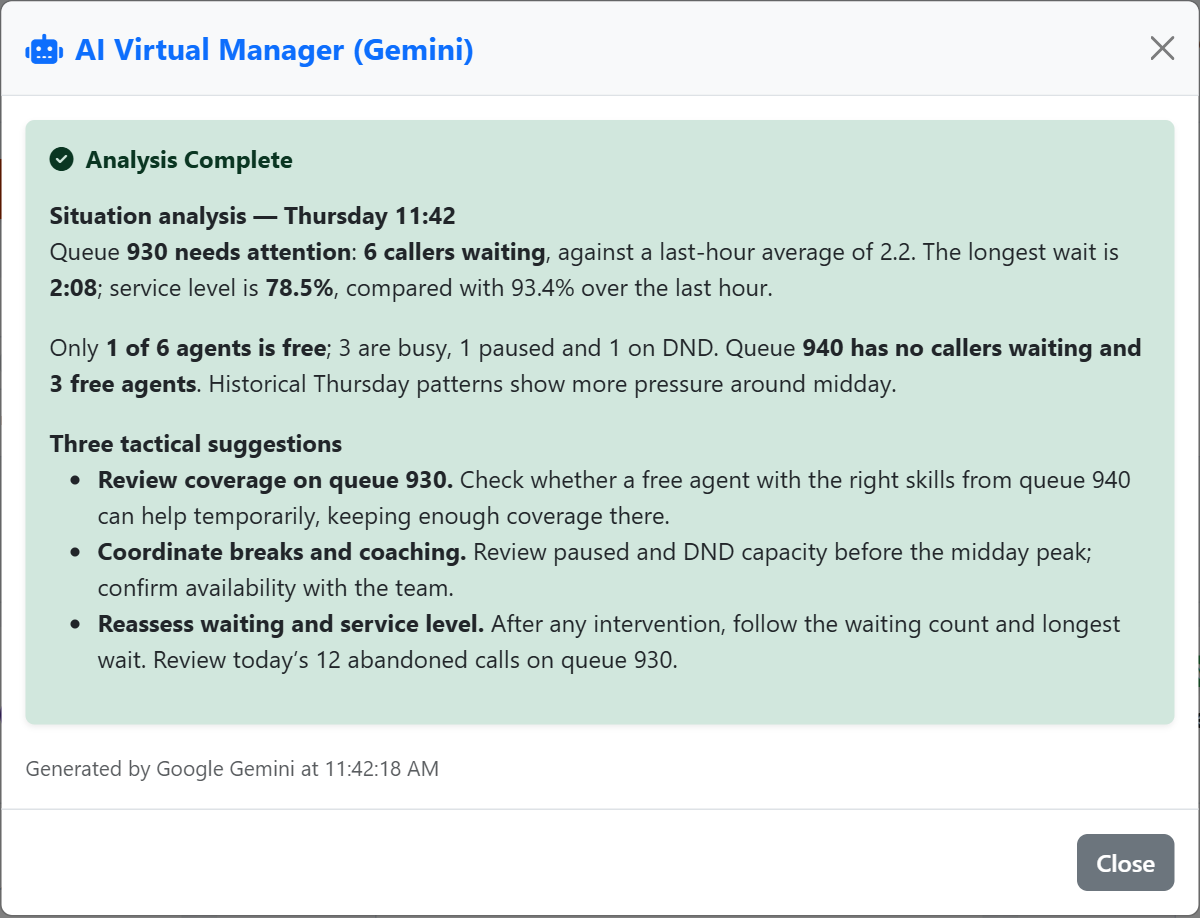
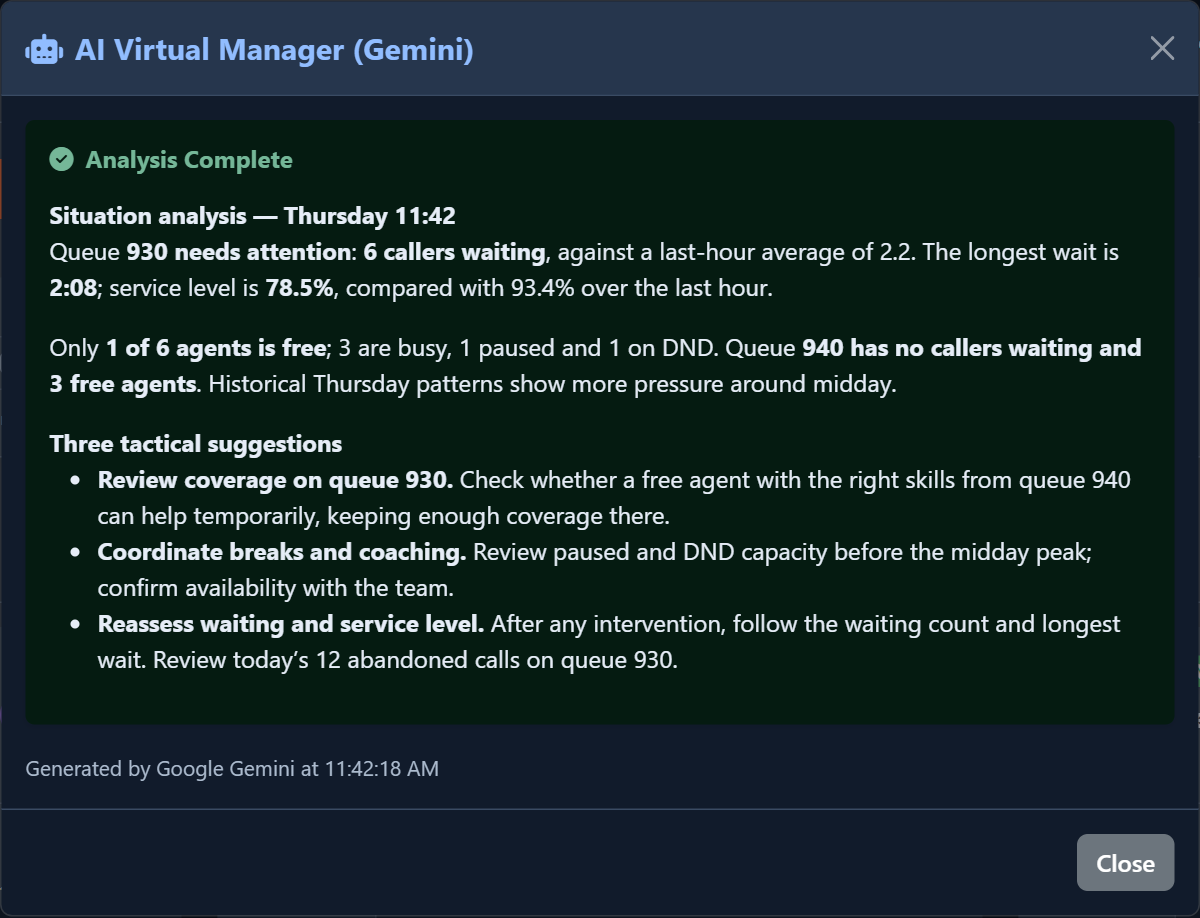
Slide the divider to compare the same workspace.
DarkWaiting calls, service levels and available, busy or paused agents: start from the live picture of the queues you can access.
Combine the current queue snapshot with the last hour’s results and the available weekly workload pattern to put pressure into context.
Get a situation summary and three tactical suggestions. Review the evidence, then choose how to adjust coverage, breaks or supervision.
Find your workspace. Every view has a purpose; together, they give you control of the whole operation.
Live queues, agent controls and personal alerts.
Your call center, visible across the room.
See extensions and active conversations.
Device health, registrations and IP location.
Turn follow-up work into organised action.
Connect call quality, sentiment, churn risk and commercial opportunities with team decisions.
Compare queue volumes, answered and missed calls, waiting times and service results.
Explore outbound activity, call outcomes and talk time by agent.
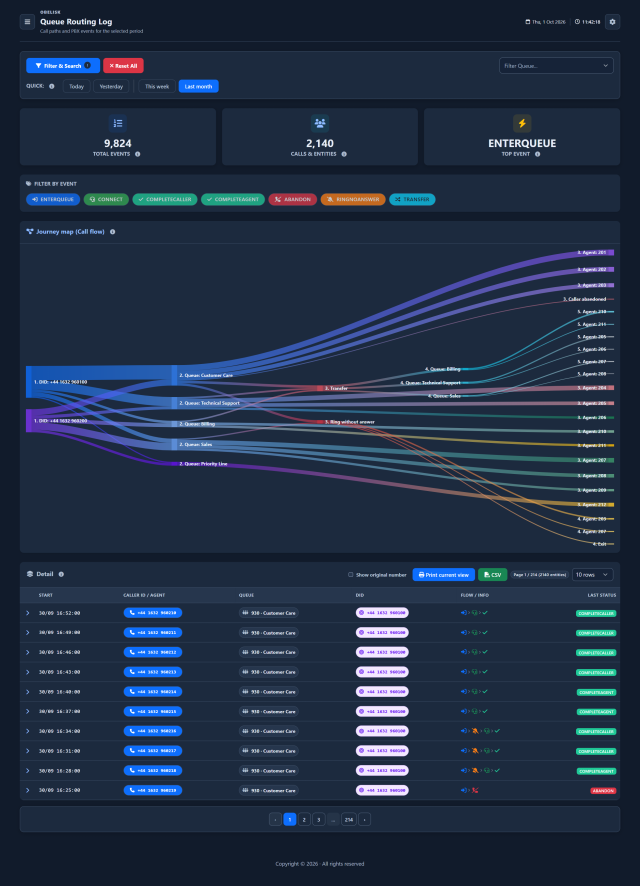
Follow queue entries, routing attempts and call outcomes through connected events and flows.
Find, listen to and review the conversation.
Sentiment, churn, opportunities and much more.
Access, preferences and operational oversight.
Anticipate demand, compare coverage scenarios and plan staff by time slot.
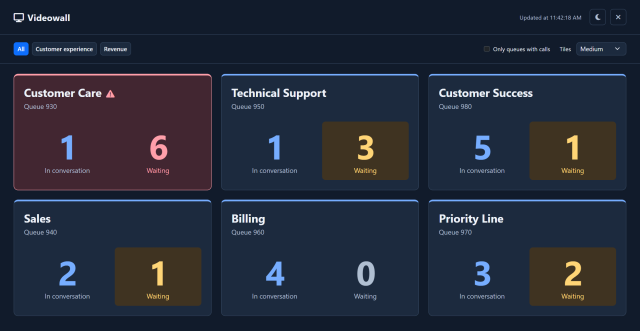
Make Videowall the focal point of your operations room. Large, readable queue information helps the whole team see where attention is needed, in a light or dark theme.
Discover VideowallSlide the divider to compare the same workspace.
DarkGo beyond call counts. Understand how customers feel, spot retention risks, uncover opportunities and give your team a clearer starting point for coaching.
Read satisfaction, uncertainty and frustration alongside the outcome of each conversation.
Connect resolution, empathy and quality to understand where coaching can help.
Connect recurring themes with concrete examples and the next action for your team.
See how many usable saved analyses contribute to the selected period.
See positive, neutral and negative sentiment counts and percentages among calls with a saved sentiment assessment.
Review average AI-assessed conversation quality on a 0–100 scale, using available scores only.
Understand how available quality scores are distributed across poor, good and excellent bands.
Separate AI-classified resolved, unresolved and escalation outcomes for conversations with an available resolution field.
Identify the most frequent AI-assigned conversation categories in the selected period.
Track average AI-assessed churn risk on a 0–10 scale, with low, medium and high risk bands.
Spot calls whose saved churn-risk score is 8 or higher for closer review.
Review recurring reasons found in calls with medium or high assessed churn risk.
See how many evaluated conversations contain an AI-identified upsell opportunity.
Reveal the competitors most often mentioned in the saved conversation analyses.
Surface recurring customer objections and how often they appear in the analyses.
Identify recurring issues and friction points described in customer conversations.
See the recurring words and themes in a keyword cloud sized by their recorded frequency.
Review average AI-assessed agent empathy on a 1–5 scale across available assessments.
Review the share of available AI assessments that indicate the privacy procedure was followed.
Identify conversations with recorded follow-up actions for the team to review.
Follow daily positive, neutral and negative sentiment volumes across the selected period.
Track daily average quality scores without confusing an average with call volume.
See how the five leading conversation categories change from day to day.
Compare usable analyses, quality, sentiment, high churn risk, resolution and category shares between two periods, with denominators and clear differences.
Read example summaries behind the highest and lowest available conversation scores.
See saved analysis totals and the split between complete, partial, failed, processing and historical records.
Know how many usable analyses contain each quality, sentiment, resolution, risk and empathy assessment.
Bring phones, softphones, reported versions, registration states and response latency into one view. Give IT a practical starting point for device maintenance and faster investigation.
Locate public IP addresses on the map, then inspect devices and connections behind each marker.
Explore Status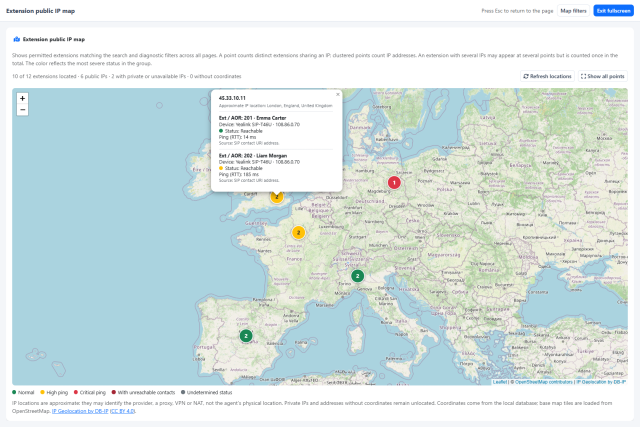
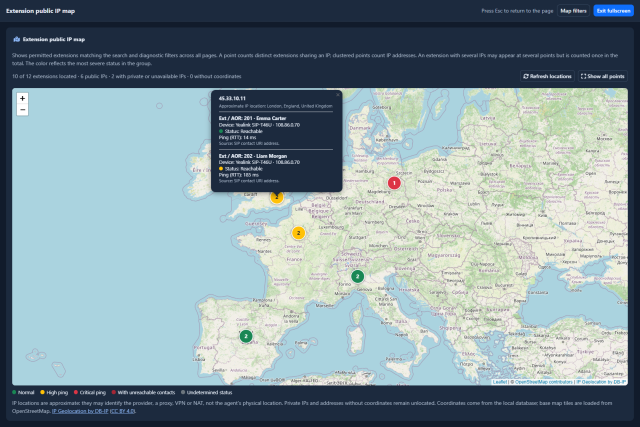
Slide the divider to compare the same workspace.
DarkCompare the make/model and firmware or software version reported by registered SIP contacts. Grouped counts make different versions visible and help you identify devices to review before planning updates.
Read the contact round-trip time reported by Asterisk alongside its registration state. Personal warning and critical thresholds, coloured badges and the high-ping filter help you focus the investigation.
Start with the extension health overview, then inspect names, devices, IP addresses, reported versions and registration expiry. Groups, search and sorting help you narrow the issue to the contacts that need attention.
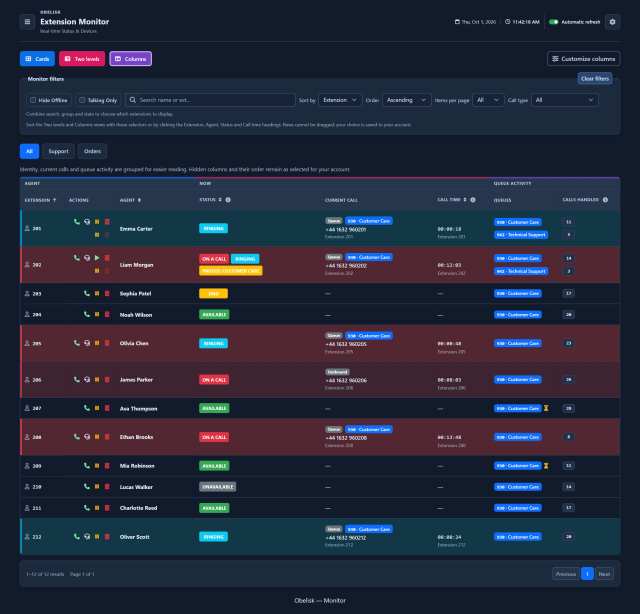
Choose Cards, Two levels or Columns. Compare each complete Monitor view in light and dark, and explore extension states, current calls and queue activity.
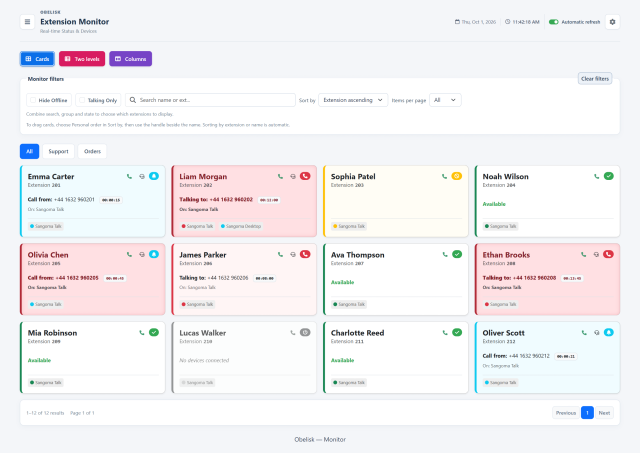
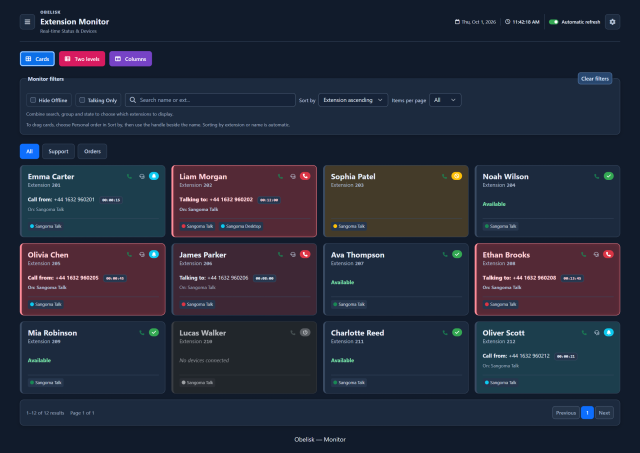
Slide the divider to compare the same workspace.
Dark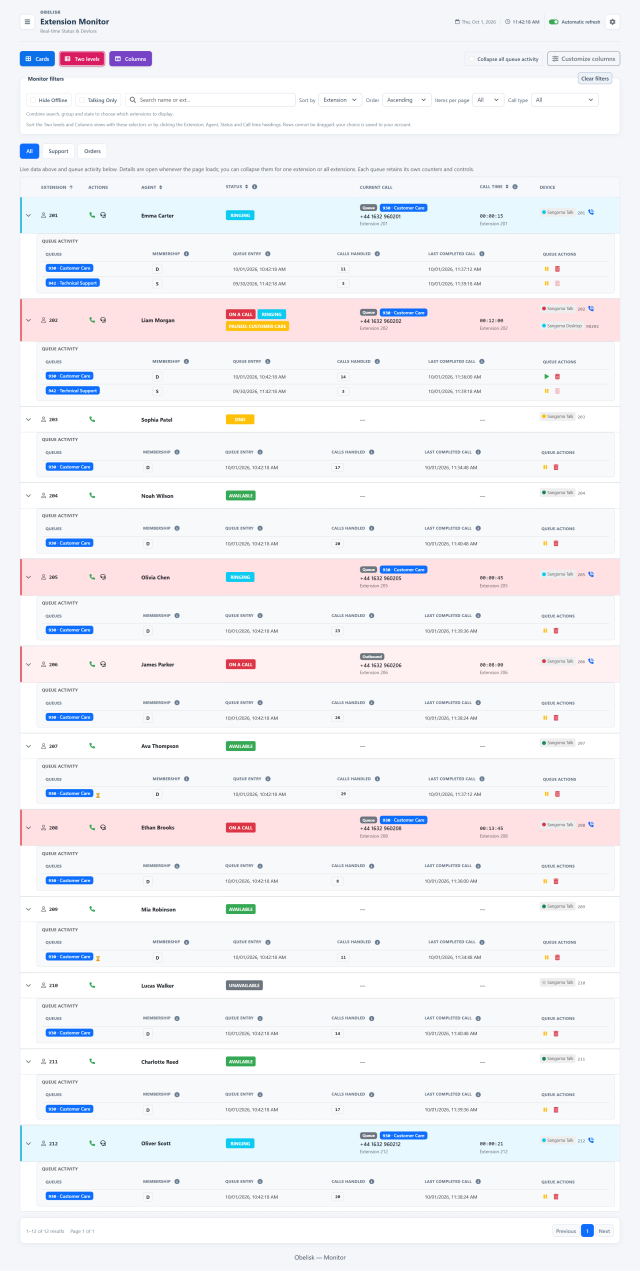
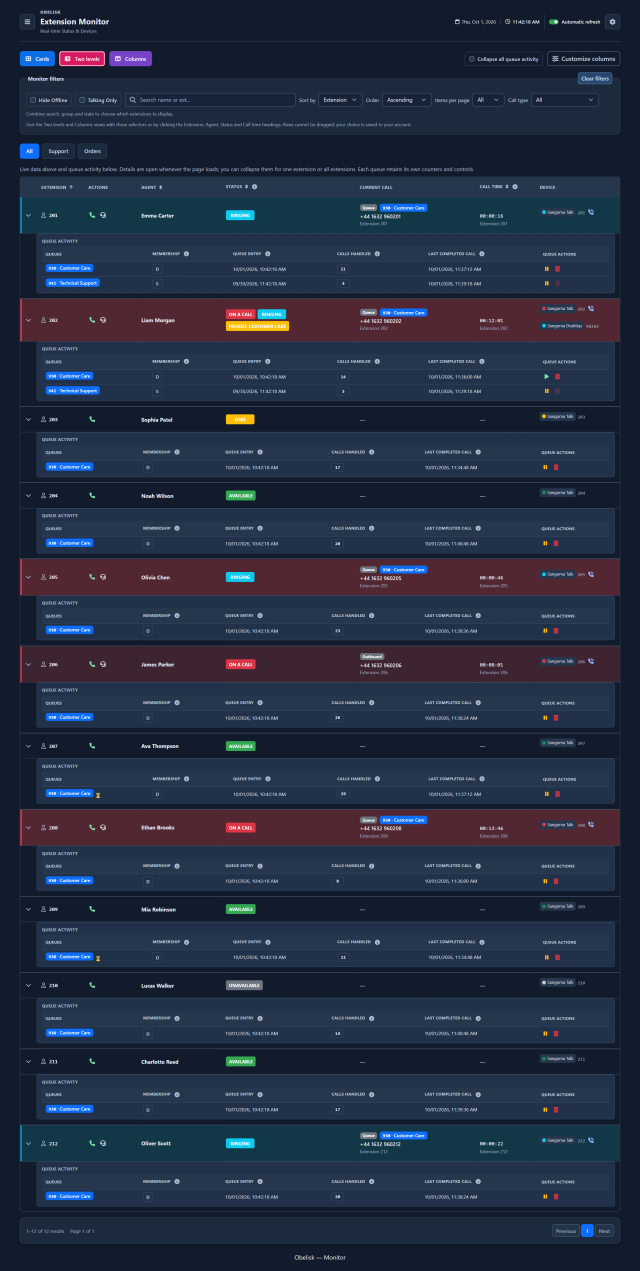
Slide the divider to compare the same workspace.
Dark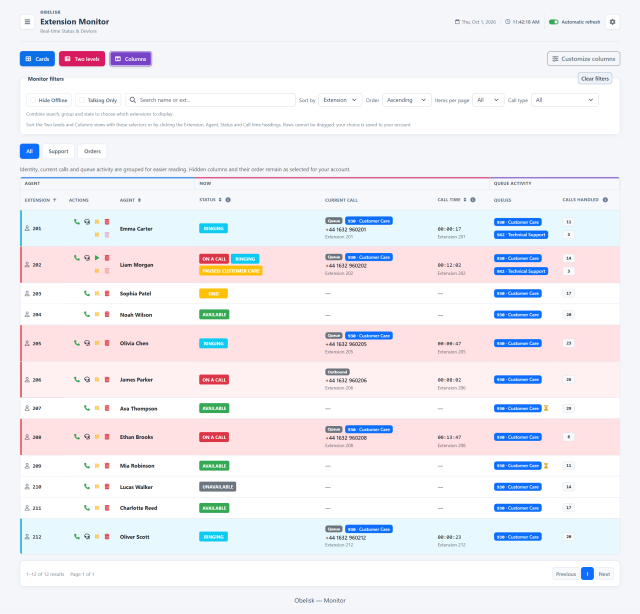
Slide the divider to compare the same workspace.
DarkChoose the time horizon that suits your call center. One complete platform, unlimited agents and queues. No recurring subscription or automatic renewal.
Compare licence plansA perpetual licence for lifetime use, or a flexible temporary licence for projects lasting up to 12 months. Unlimited agents and queues with either choice. No automatic renewal.
Your installation, your operational data and your recordings. Manage access, storage and retention within your own environment. You decide whether to use AI.
Turn the PBX you already use into a connected workspace for supervision, reports, call journeys and planning. Compatible with FreePBX 17 and Asterisk 22.
Try Obelisk on your infrastructure for seven days. Follow the installation guide and activate the trial directly from your PBX.
For information: info@obsk.io