
The signal is there.
What happens next?
More calls, repeated contacts, queues under pressure. Explore ten situations a Team Leader can investigate by bringing the right views together.
Find your starting pointIllustrative scenarios. Real product workflows.
- 01Spot the signal↓
- 02Read the evidence↓
- 03Choose an action↓
- 04Check the outcome
Where does your day get complicated?
Choose a case. Follow the checks and open the related product views.
10 cases in the index
More calls handled. Fewer problems solved?
Answered calls are rising and some agents finish conversations unusually quickly. Customers keep calling back, so the apparent gain deserves a closer look.
Follow the evidence
- Global Dashboard
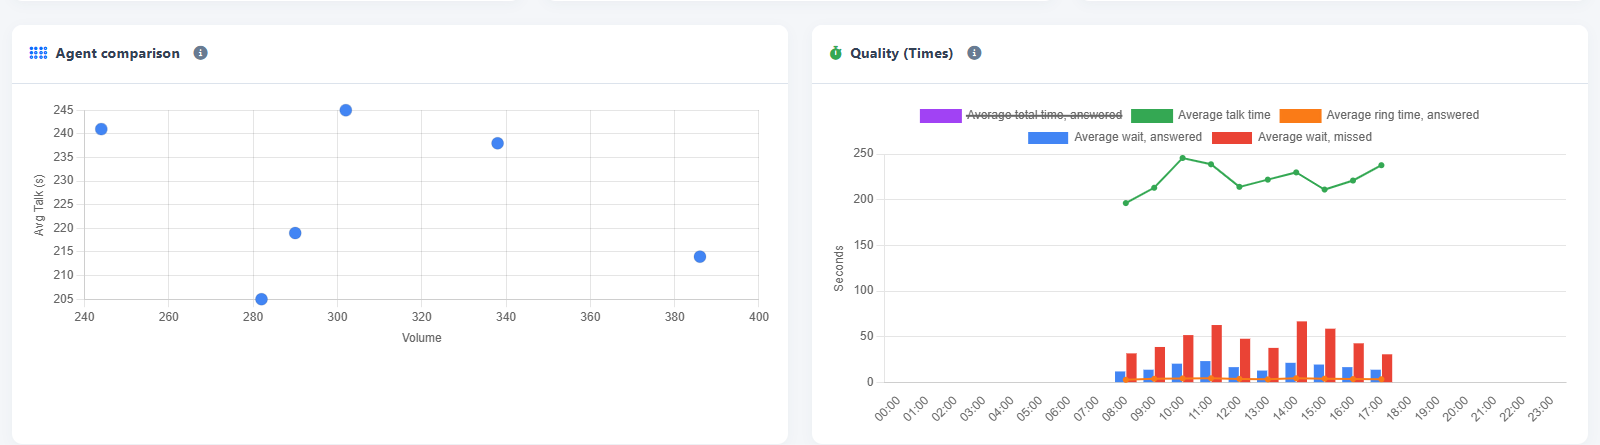
Compare each agent’s call count with conversation time in the scatter chart. Identify patterns to investigate, then use Answered Calls to examine the agent, queue and conversations under ten seconds.
- Recordings
Listen to a sample of short calls alongside longer conversations from the same service. Check whether the request was understood, handled or left open.
- Quality and AI
Compare outcomes, quality and sentiment in the analysed conversations. Read the number of analysed calls alongside the scores and relate the findings to repeat contacts.
Choose targeted coaching, clearer procedures or a different allocation of requests according to what the conversations reveal.
Review outcomes and repeat contacts after the change, alongside call volume and conversation time.
A short conversation can be efficient: resolution and repeat contacts help explain what the duration alone cannot.
The callback that sends customers back into a full queue
A customer requests a callback, but the return call arrives while all agents are still busy. Another wait leads to another call and another request.
Follow the evidence
- Contacts and journeys
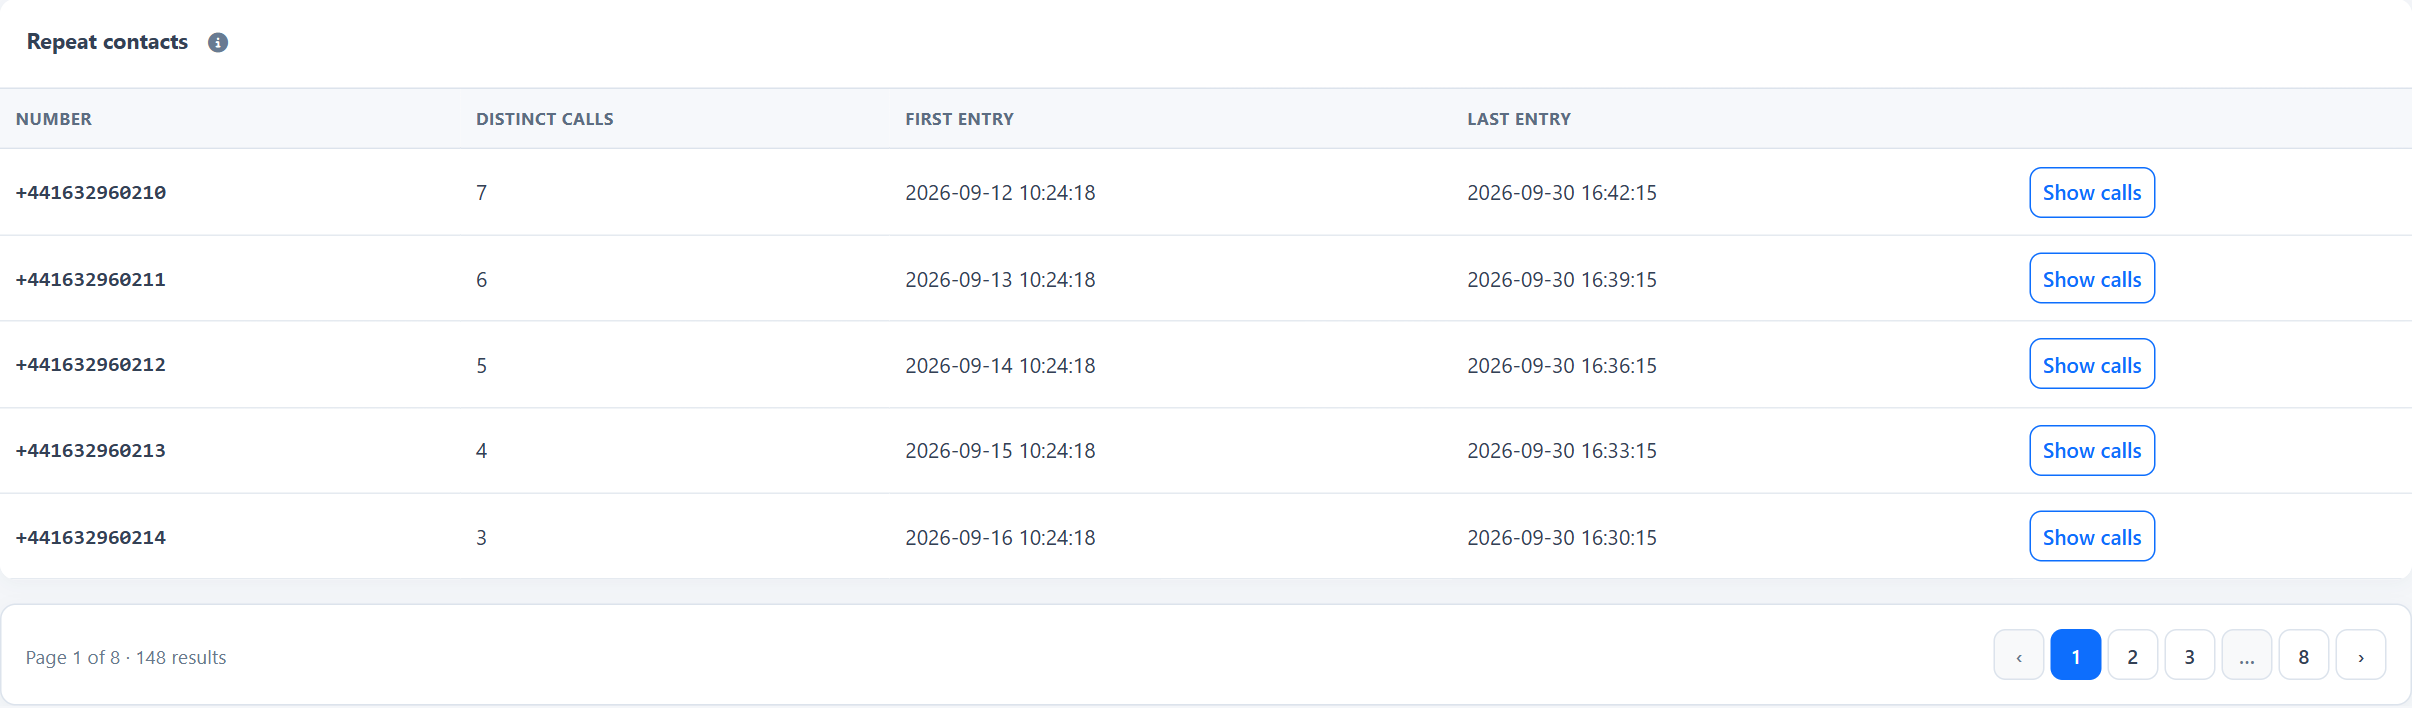
Find numbers associated with many distinct calls, including customers who appear ten times. Compare their first and last entries and open the associated calls.
- Queue Routing Log
Follow entries, ringing attempts, connections and exits for the selected calls. Check whether the customer returns to a queue already under pressure.
- Outbound Calls
Compare outgoing attempts, times and outcomes with the callback system’s PBX logs. Relate the timeline to agent availability before drawing a conclusion.
Review callback timing and capacity with the PBX administrator; consider dedicated coverage and assign follow-up ownership in the Action centre.
Track repeat contacts and completed follow-ups, checking whether returned calls still enter an overloaded queue.
Ten calls from one number are ten contacts to investigate; callback requests are confirmed by the callback system’s own records.
Monday morning: more people, or better timing?
Missed calls rise every Monday morning while other periods stay quiet. Daily totals hide the hours in which coverage is most stretched.
Follow the evidence
- Global Dashboard
Compare hourly volume, answered and missed calls, then read the day-and-hour heatmap. Identify the recurring window rather than stopping at the daily total.
- Missed Calls
Filter the affected queues and periods. Compare waiting times and exit reasons to understand where demand and service coverage stop matching.
- Workload and forecasts
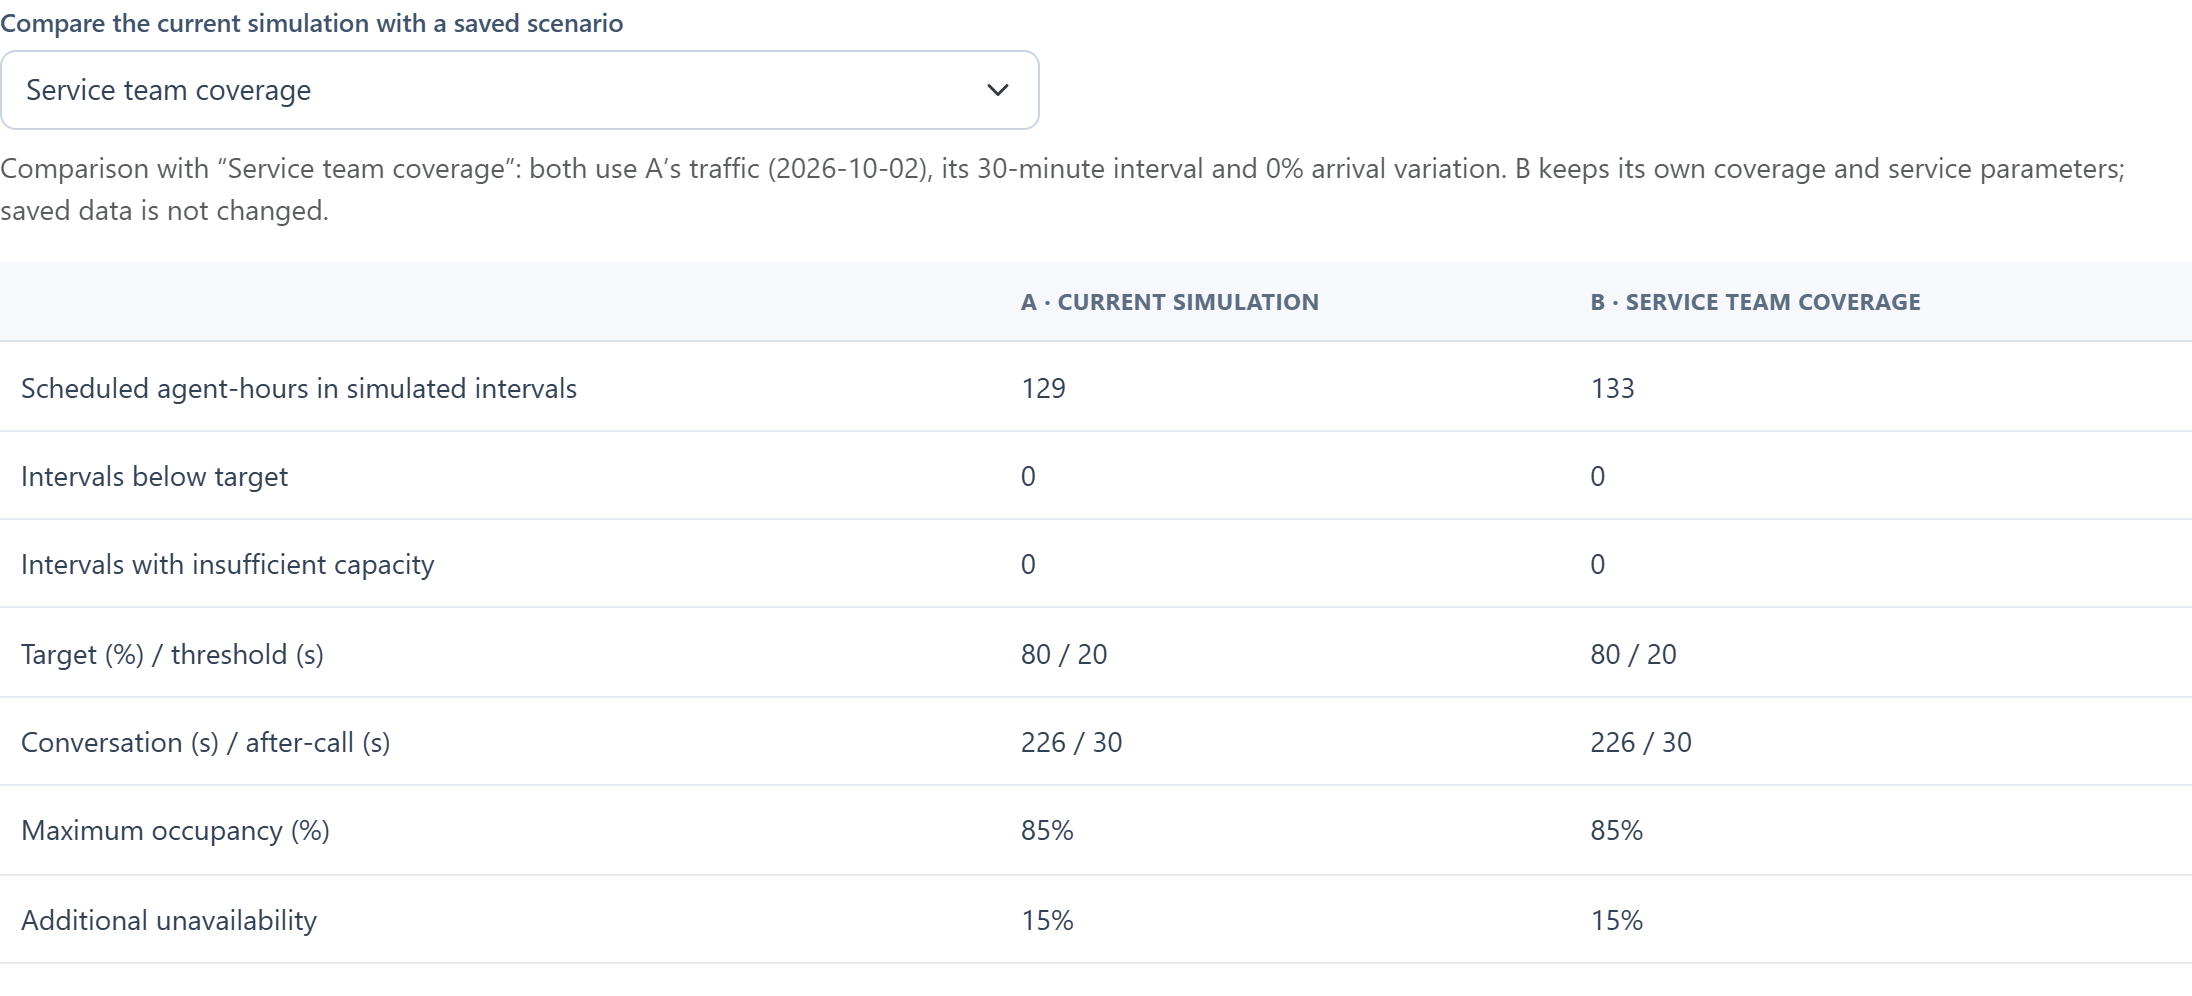
Open the queue, review forecast arrivals and use the Erlang C coverage simulator. Compare staffing scenarios with the same demand and handling-time assumptions.
Evaluate different start times, breaks and queue assignments around the busiest hours.
Compare subsequent Mondays at similar demand levels and check whether the change shifts pressure onto other queues.
The simulator compares assumptions: validate the selected demand and handling time before using its staffing estimate.
Three departments. The same story, three times.
A customer moves from sales to support and then to billing. Each transfer adds another explanation and another wait, sometimes ending in abandonment.
Follow the evidence
- Contacts and journeys
Compare observed origins and destinations between queues. Open repeated paths to identify the handoffs worth investigating.
- Queue Routing Log
Expand a call and follow the event sequence, queue entries, connections, transfers and exits. Locate the point at which the journey becomes complicated.
- Recordings
Listen to the available conversations to understand why the customer was transferred and whether the request was passed on clearly.
Clarify each department’s responsibilities, review initial routing and agree what information should accompany a transfer.
Review queue transitions, waits, repeat contacts and conversation outcomes after the procedure changes.
A transfer can be the right next step; the event sequence and conversation explain whether it helped the customer.
Agents seem available. Why does the phone keep ringing?
Unanswered ringing attempts rise even though the team seems adequately staffed. The supervisor needs to understand whether the cause is operational or technical.
Follow the evidence
- Ring No Answer
Compare agents, queues, hours and ringing duration. Check whether the attempts concentrate on particular extensions or repeat across the whole service.
- Extension monitor
Check current extension states and relate them to the live queue context. Review pauses, membership and the way the team handles incoming attempts.
- Status
Inspect SIP registrations, unreachable contacts and unusual response latency. Use device and public-IP information to focus the technical investigation.
Adjust working practices where needed or involve IT with the affected extensions, times and device evidence.
Compare unanswered ringing attempts after the intervention and verify extension reachability during the affected hours.
An unanswered agent attempt is not automatically a missed customer call: another agent may answer it.
The phone bill is rising. Which traffic explains it?
Outgoing call costs increase even though the total call count barely changes. Longer calls, different destinations or repeated unsuccessful attempts may explain the difference.
Follow the evidence
- Outbound Calls
Compare periods and group traffic by line and agent. Read call counts, duration and outcomes, then inspect called numbers and available dial-out codes.
- Database and catalogues
Check the line catalogue and number normalization so that labels and destinations are interpreted consistently in the traffic review.
- Follow-up in the Action centre
Assign the review to an owner and record findings. Compare the exported traffic with the provider’s invoices, tariffs and included allowances.
Evaluate routing choices, repeated attempts and contract conditions using the traffic that actually generates cost.
Compare comparable periods by line and destination, then confirm any saving against the provider’s billed amounts.
Traffic metrics describe usage; monetary cost depends on the provider’s tariffs, rounding and allowances.
More calls—or the same unresolved problem?
A billing change or a new procedure is followed by a surge in calls. Extra staffing absorbs the pressure, but customers keep asking about the same issue.
Follow the evidence
- Quality and AI
Examine recurring categories, topics and pain points in analysed conversations. Use weekly and monthly AI summaries to follow how the issue evolves.
- Recordings
Open examples and listen to what customers actually ask. Verify the issue and the response before sharing evidence with the responsible department.
- Global Dashboard
Compare traffic before and after the change, by period and queue. Relate the conversation findings to the size and timing of the demand increase.
Bring examples to the relevant department and improve the message, process or service that is generating the calls.
Follow the topic in subsequent analyses and review call volumes, outcomes and the number of conversations analysed.
A recurring AI topic is a lead to verify in recordings; its weight depends on the conversations included in the analysis.
The campaign reaches a new area. Is the service ready?
A campaign generates requests from a new area, but staffing still follows the previous pattern. The overall total looks manageable while particular hours and queues become stretched.
Follow the evidence
- Answered Calls
Combine date range, queue and quick filters with telephone origin by country, area and city. Read maps and grouped results together.
- Missed Calls
Apply comparable filters to missed calls. Check whether specific origins and time windows coincide with greater waiting or abandonment.
- Workload and forecasts
Examine the affected queues and compare coverage scenarios. Add the campaign plan to the discussion when recent history does not yet reflect the expected demand.
Coordinate campaign timing and service coverage, and prepare agents for the requests the campaign is likely to generate.
Compare answered and missed calls, waiting and volumes for the selected origins, periods and queues.
Telephone geography comes from available number prefixes; it describes the number’s origin rather than the caller’s live location.
Everyone sees the customer to call back. Who owns the task?
A number appears repeatedly among missed calls and several supervisors notice it. Follow-up stays in informal messages, with everyone assuming a colleague has already called.
Follow the evidence
- Missed Calls
Identify the calls to review using queue, period and outcome. Establish which customer contacts need a follow-up rather than treating every missed event alike.
- Contacts and journeys
Review the number’s distinct calls and open their routing context. Check whether a later conversation has already addressed the request.
- Follow-up in the Action centre
Create or confirm the task, assign an owner, priority and due date. Record attempts, notes and the outcome so that the team can follow the work.
Agree who performs the callback, when it should happen and what evidence is needed to close the task.
Review open, overdue and completed tasks, checking that closure includes an outcome rather than only an attempt.
The Action centre organizes follow-up; the agent places the call and records how the request was handled.
Queue coverage drops suddenly. What changed?
Incoming volume is normal, but waiting times climb quickly. Several agents are paused or no longer appear in the queue.
Follow the evidence
- Dashboard
Read current waiting calls, agent states and queue membership. Identify the affected service and the people whose state needs checking.
- Operational action log
Filter by time and action to review pauses, resumptions and removals requested through Obelisk. Read the user, source screen, target and recorded outcome.
- Users and access profiles
Review who can perform the relevant commands and which queues each supervisor can see. Use reusable profiles and individual exceptions to align access with responsibilities.
Restore the intended coverage where appropriate, then correct the procedure or permissions that allowed the unwanted change.
Follow waiting and agent states in the live views, and verify the outcomes of subsequent corrective commands.
The log records commands sent through Obelisk: read their outcomes to distinguish a request from a confirmed action.
Bring your own situation.
Explore the workspaces behind these cases or request a demo to see Obelisk on your infrastructure.