Coming Soon
FreePBX 17 Ready Asterisk 22 Ready PHP 8 Engine Real-time AJAX

The Next-Gen Asterisk
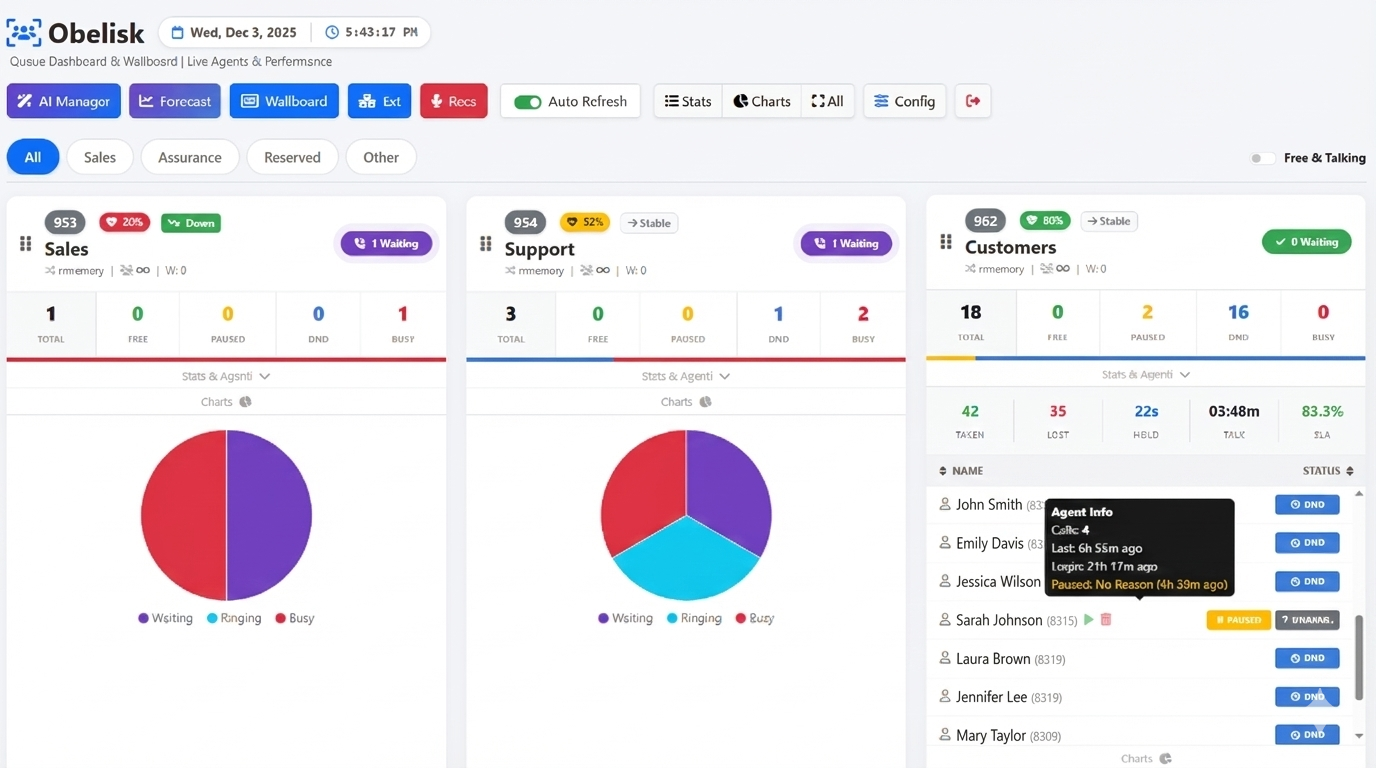
Queue Dashboard

Real-time monitoring, AI-driven forecasting, and complete quality assurance for modern call centers. Engineered for speed, scalability, and strategic insight.

Obelisk Dashboard Interface

Core Features

Real-Time Control & Monitoring

Real-Time Dashboard & Wallboard

The core of Obelisk is its ability to visualize queue status instantly via the Asterisk Manager Interface (AMI).

  • Dual Views: Dashboard (Detailed cards) & Wallboard (Streamlined for TV).
  • Live Metrics: Waiting, Abandoned, SLA, Answered, Hold & Talk time.
  • Algorithmic Health Score: Dynamic 0-100% "Traffic Light" indicator.
  • Visual Alerts: Blinking thresholds for calls waiting and idle times.
  • Global Filters: "Free & Talking" toggle available on all views.

Advanced Agent Management

Complete control over agent status and real-time performance tracking.

  • Control Actions: Force Pause/Unpause, Log Out, or Start Monitoring.
  • Agent Watchdog: Idle time monitoring with configurable alerts.
  • Rich Info: Tooltips with Last Login, Call Count, and Pause Reasons.
  • Multi-Status Badges: Visual indicators for Pause, DND, Ringing, Talking, etc.
  • Dynamic Charts: Real-time Pie charts (Waiting vs Ringing vs Talking).
  • Agent Info: Tooltips Last Login, Calls Count/Time, Pause Duration/Reason
  • Global Toggle & Sorting: Sort agents by Status or Name.
  • Real-time statistics: Total, Free, Paused, DND, Busy, and Talking agents.
  • Global View Filters: "Free & Talking" toggle available.

Live Supervisor Monitoring

Obelisk allows supervisors to intervene in live calls seamlessly.

1. Listen (Spy)

Silent monitoring; neither agent nor customer can hear you.

2. Whisper (Coach)

Speak only to the agent (coaching) without the customer hearing.

3. Barge (Conference)

A three-way conference where everyone can hear and speak.

Powered by Google Gemini

AI Virtual Manager

Obelisk acts as an intelligent assistant, analyzing live data and history to provide actionable insights.

Strategic Advice

Tactical advice based on live queue data + historical trends (e.g., "Shift staff to Sales queue" or “SLA is dropping”).

Context Awareness

Decisions based on real-time data, 1-hour trends, and historical staffing heatmaps.

Smart Throttling

Built-in rate limiting (1 request/60s) prevents API quota abuse, while ensuring fresh data.

Quality Assurance

A complete suite for recording management and analysis. Full interface to browse, filter, and play audio recordings.

  • Audio Robot (Cron):

    Background CLI script scans, transcribes, and analyzes recordings automatically.

  • AI Analysis:
    • Sentiment (Positive, Neutral, Negative)
    • Resolution Detection (Resolved/Unresolved/Escalation)
    • Summary of the call
    • An easy icon system that identifies each phone call
    • Topic Categorization & Automatic tagging
    • Word Cloud: Visualizes frequent keywords.
  • Chat-Style Transcripts: Readable format separating Agent and Customer.
  • Advanced Player: Waveform visualization with precise duration.
  • CSV Export: Full data export including AI metadata.

Data Driven Insights

Forecasting & Diagnostics

Predictive Tools

Tools to help managers plan ahead.


  • Traffic Forecast: Uses linear regression to predict volume for the next 15 minutes.
  • Staffing Heatmap: Visual matrix of historical load by Day/Hour.
  • SLA Analysis: Breakdown based on Queue Weight (Premium vs. Standard).

Quality Dashboard

Visual charts within the Forecast module.


  • Sentiment Distribution: Charts for Pos/Neu/Neg calls.
  • Resolution Stats: Track issue resolution rates.
  • AI Word Cloud: Visual representation of frequent topics/keywords.

Extension Diagnostics

PJSIP health monitoring tool for IT staff.


  • Latency Monitoring: RTT/Ping with color-coded alerts (>100ms warning, >400ms critical).
  • Device Info: User Agent (Brand/Model), Firmware, and registered IP addresses.
UNDER THE HOOD

Technical Architecture & Performance

Obelisk is engineered for speed and scalability, solving common issues like the "Thundering Herd" problem. Fully optimized for the latest Asterisk ecosystems.

SQLite WAL Mode High-concurrency I/O
PHP 8 Engine JIT Compilation
Server-Side Micro-Caching

Reduces load on Asterisk AMI by ~90% using file-based locking (2s cache).

Thundering Herd Protection

Non-blocking locks (Flock) prevent server overload during concurrent access.

Frontend Hash Check

Client checks data hashes before modifying DOM, eliminating flickering and CPU usage.

Background Processing

Heavy tasks (History logging, Audio analysis) are offloaded to CRON scripts.

Robust PJSIP Parsing

Fixes for FreePBX 17 complex strings and Interface parsing.

Page Visibility Auto-Pause

Stops refresh when tab is hidden to save resources.

Full Control

Admin & Customization

Custom Sections

Group queues logically (Sales, Support) via Drag & Drop.

Privacy Modes

Hide agent real names and mask caller numbers for GDPR.

Multi-Language

Built-in IT, EN, ES support with browser auto-detection.

Configuration

Portable JSON config and Admin Panel for sensitive settings.

Section Management

Create, Rename, Sort, and Delete sections/tabs.

Visibility Management

Hide specific queues globally or per section.

Drag & Drop

Reorder Queues and Sections via UI (Dashboard & Wallboard).

Alert and Watchdog

Idle time monitoring with configurable alert.

Safeguards

Security & Stability

Authentication

Web-based login session management.

Admin Panel

Protected area for sensitive configurations.

Input Sanitization

Strict handling of API keys and inputs.

Secure Session

Robust session management.

Smart AI Throttling

Limits API calls (1/60s) to prevent abuse.

History Tracking

SQLite logging with optimized indexes.

Systematic Pruning

Auto-cleanup via Cron for stability.